Fillable Printable Basal Body Temperature (BBT) Chart
Fillable Printable Basal Body Temperature (BBT) Chart

Basal Body Temperature (BBT) Chart

Basal Body Temperature (BBT) Chart
Month: _______________________
Temperature (degrees farenheit)
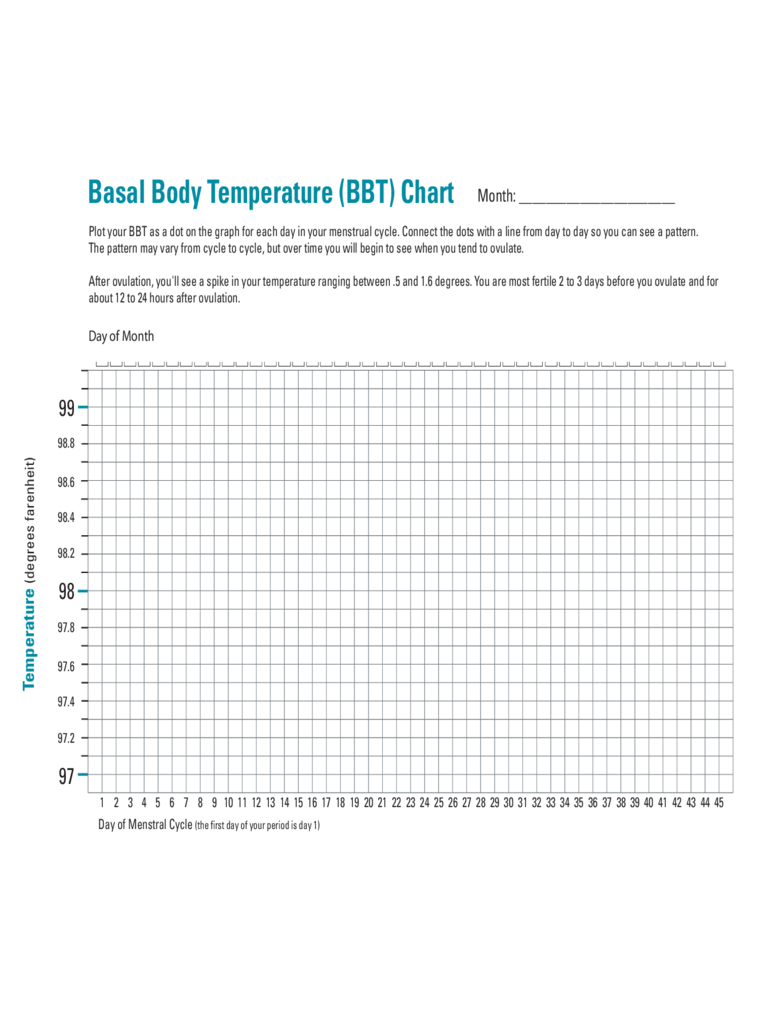
Plot your BBT as a dot on the graph for each day in your menstrual cycle. Connect the dots with a line from day to day so you can see a pattern.
The pattern may vary from cycle to cycle, but over time you will begin to see when you tend to ovulate.
After ovulation, you'll see a spike in your temperature ranging between .5 and 1.6 degrees. You are most fertile 2 to 3 days before you ovulate and for
about 12 to 24 hours after ovulation.
Day of Month
99
98.8
98.6
98.4
98.2
98
97.8
97.6
97.4
97.2
97
1 2 3 4 5 6 7 8 9 10 11 12 13 14 15 16 17 18 19 20 21 22 23 24 25 26 27 28 29 30 31 32 33 34 35 36 37 38 39 40 41 42 43 44 45
Day of Menstral Cycle (the first day of your period is day 1)


