Fillable Printable CDC Growth Charts for Girls
Fillable Printable CDC Growth Charts for Girls
CDC Growth Charts for Girls

File Name: CDCGrowthChartsHeader.doc / Printed: 7/20/2003
Growth Charts for Girls
Part of The Centers for Disease Control is the National Center for Health Statistics. This group runs the National
Health and Nutrition Examination Survey which tracks a wide range of health related statistics.
This document contains the CDC statistical data on growth v height v weight and other information. In addition, you
may visit the CDC website for more information.
Related Links:
The Centers for Disease Control: http://www.cdc.gov
National Center for Health Statistics: http://www.cdc.gov/nchs
National Health and Nutrition Examination Survey: http://www.cdc.gov/nchs/nhanes.htm
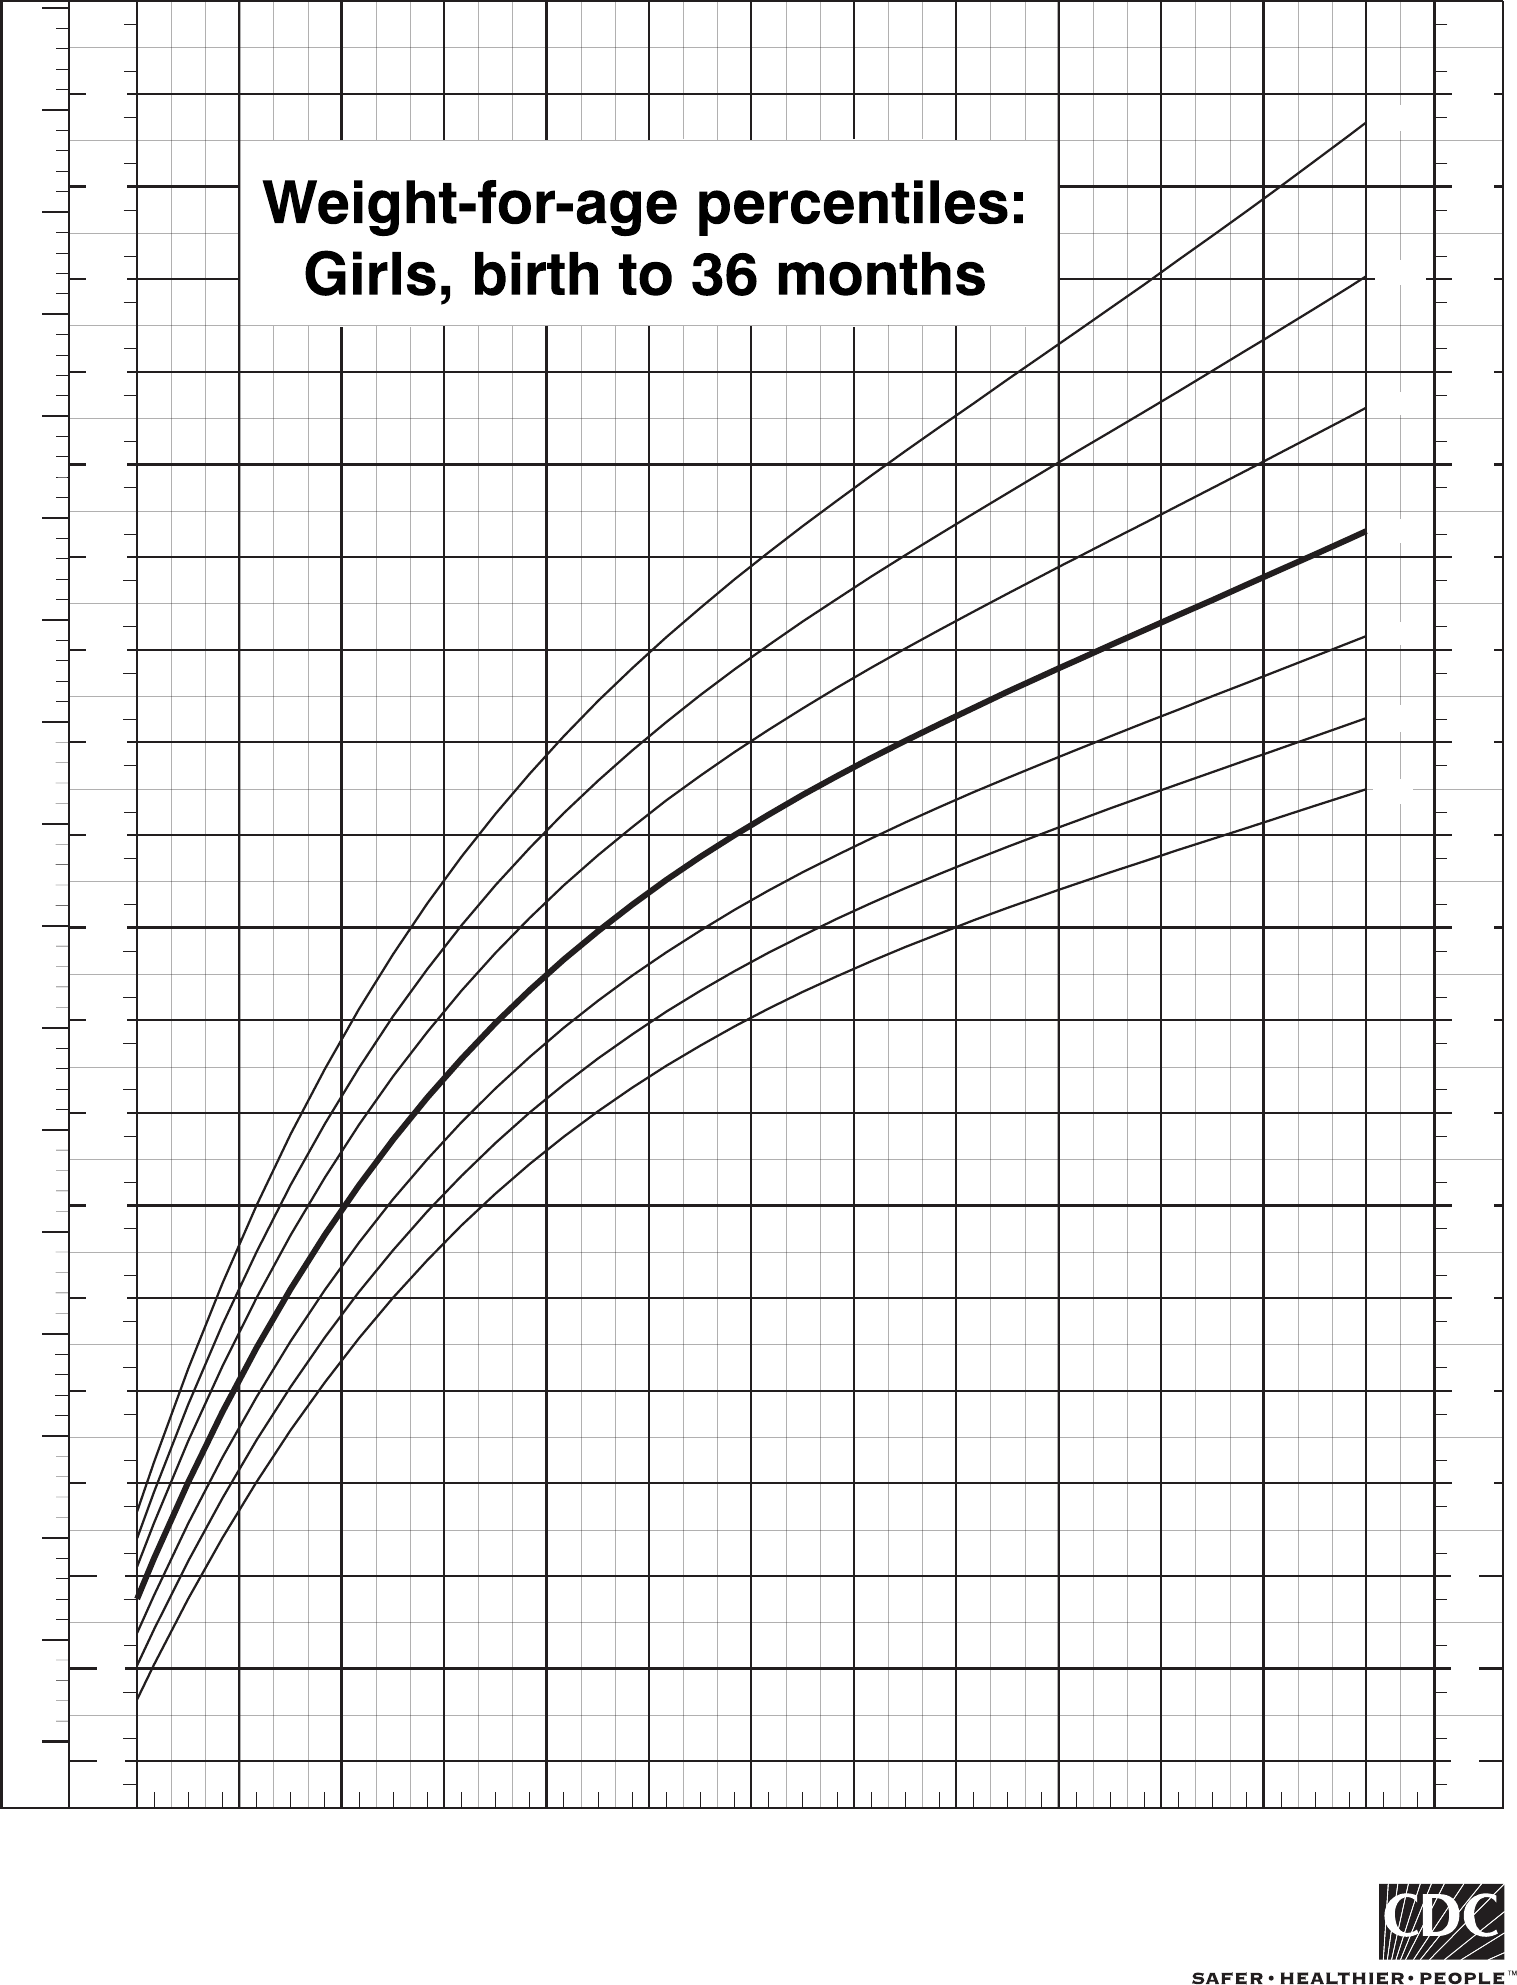
Age (months)
Birth 36912 15 18 21 24 27 30 33 36
97th
90th
75th
50th
25th
10th
3rd
kg
2
3
4
5
6
7
8
9
10
11
12
13
14
15
16
17
18
4
6
8
10
12
14
16
18
20
24
22
26
28
30
32
34
36
38
40
lb
kg
lb
4
6
8
10
12
14
16
18
20
24
22
26
28
30
32
34
36
38
40
lb
lb
CDC Growth Charts: United States
SOURCE: Developed by the National Center for Health Statistics in collaboration with
the National Center for Chronic Disease Prevention and Health Promotion (2000).
Published May 30, 2000.
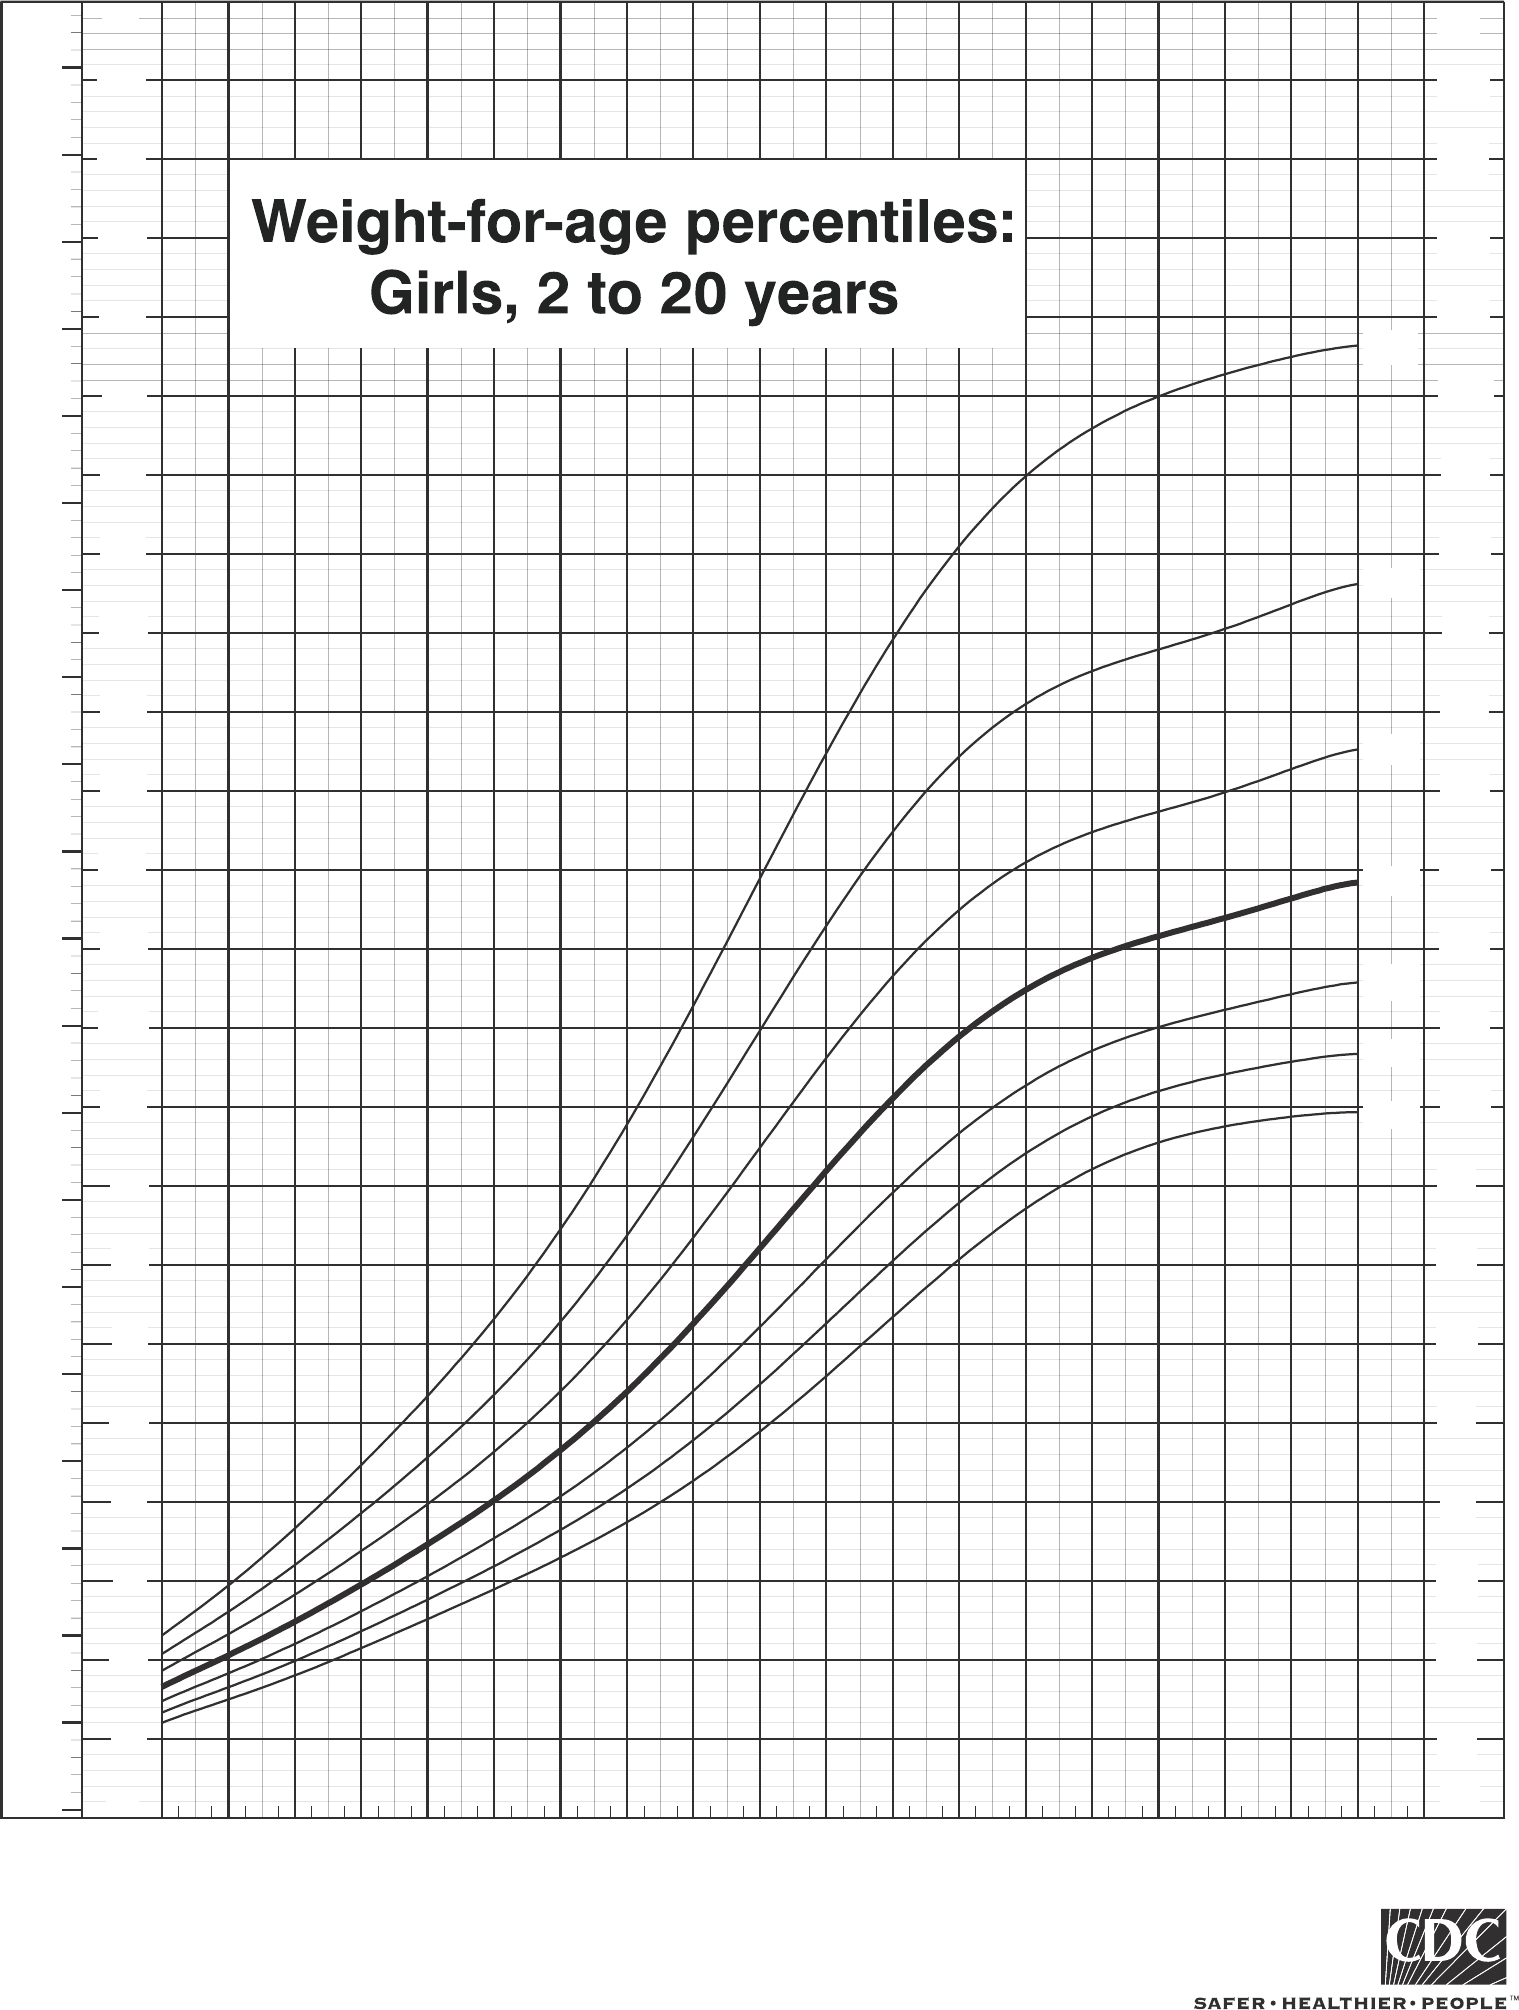
2 3 4 5 6 7 8 9 10 11 12 13 14 15 16 17 18 19 20
Age (years)
50th
25th
10th
75th
90th
3rd
10
15
20
25
30
35
40
45
50
55
60
65
70
75
80
85
90
95
100
105
kg
kg
230
210
200
190
180
170
160
150
140
130
120
110
100
90
80
70
60
50
40
30
20
lb
lb
220
20
30
40
50
60
70
80
90
100
110
120
130
140
150
160
170
180
190
200
210
230
lb
lb
220
97th
CDC Growth Charts: United States
SOURCE: Developed by the National Center for Health Statistics in collaboration with
the National Center for Chronic Disease Prevention and Health Promotion (2000).
Published May 30, 2000.
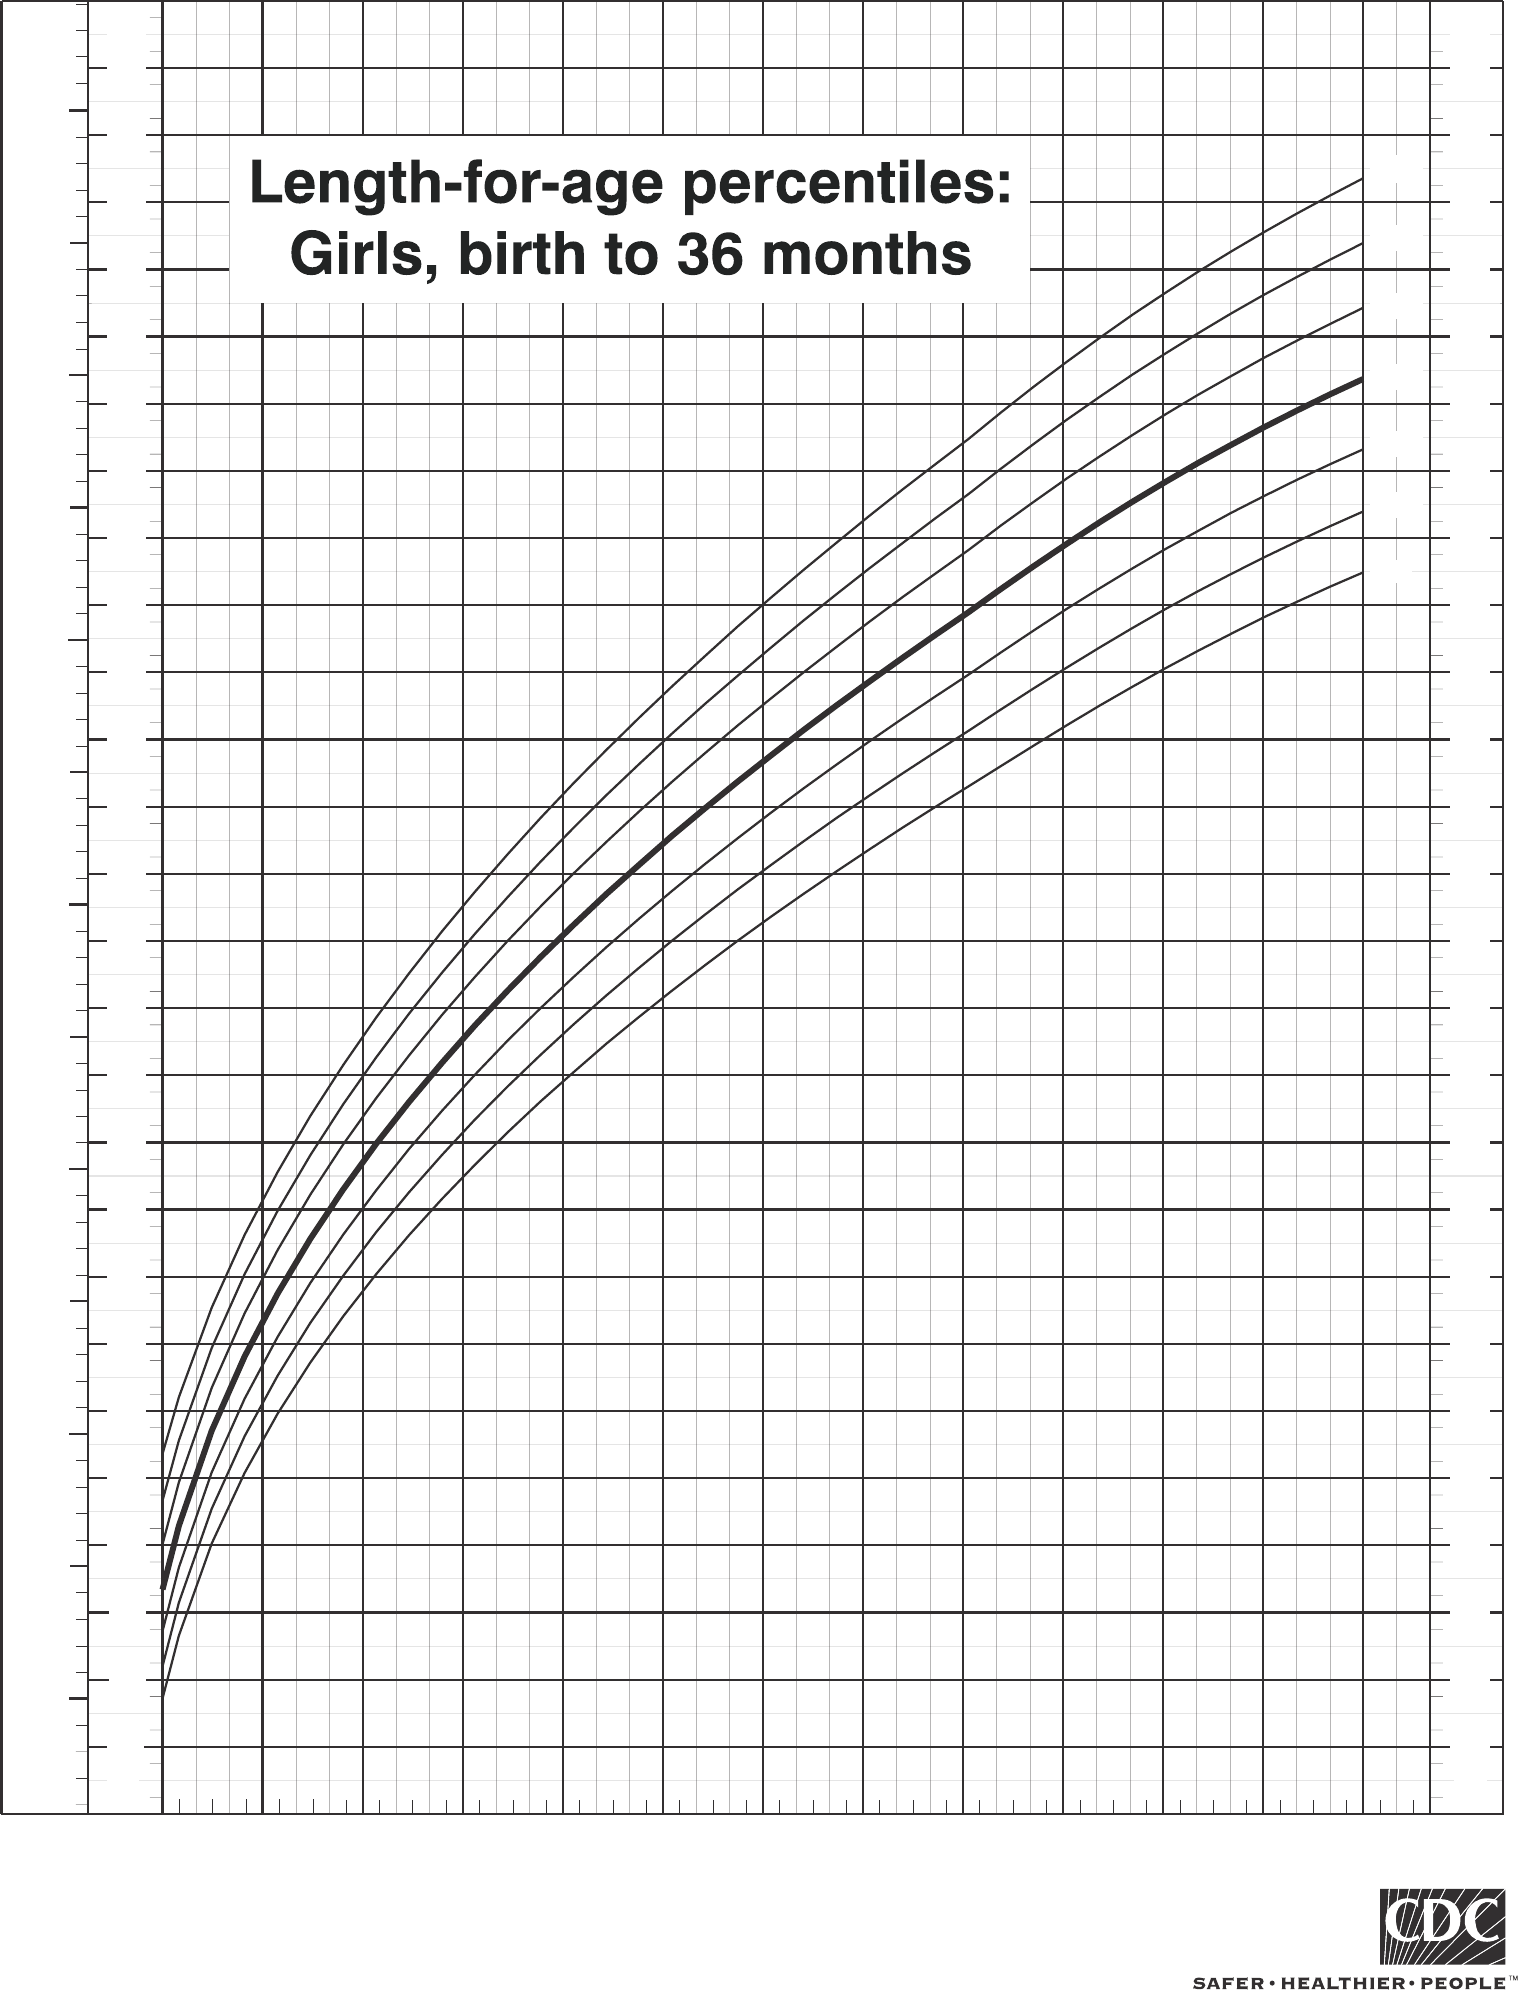
Birth 36912 15 18
21
24 27 30 33 36
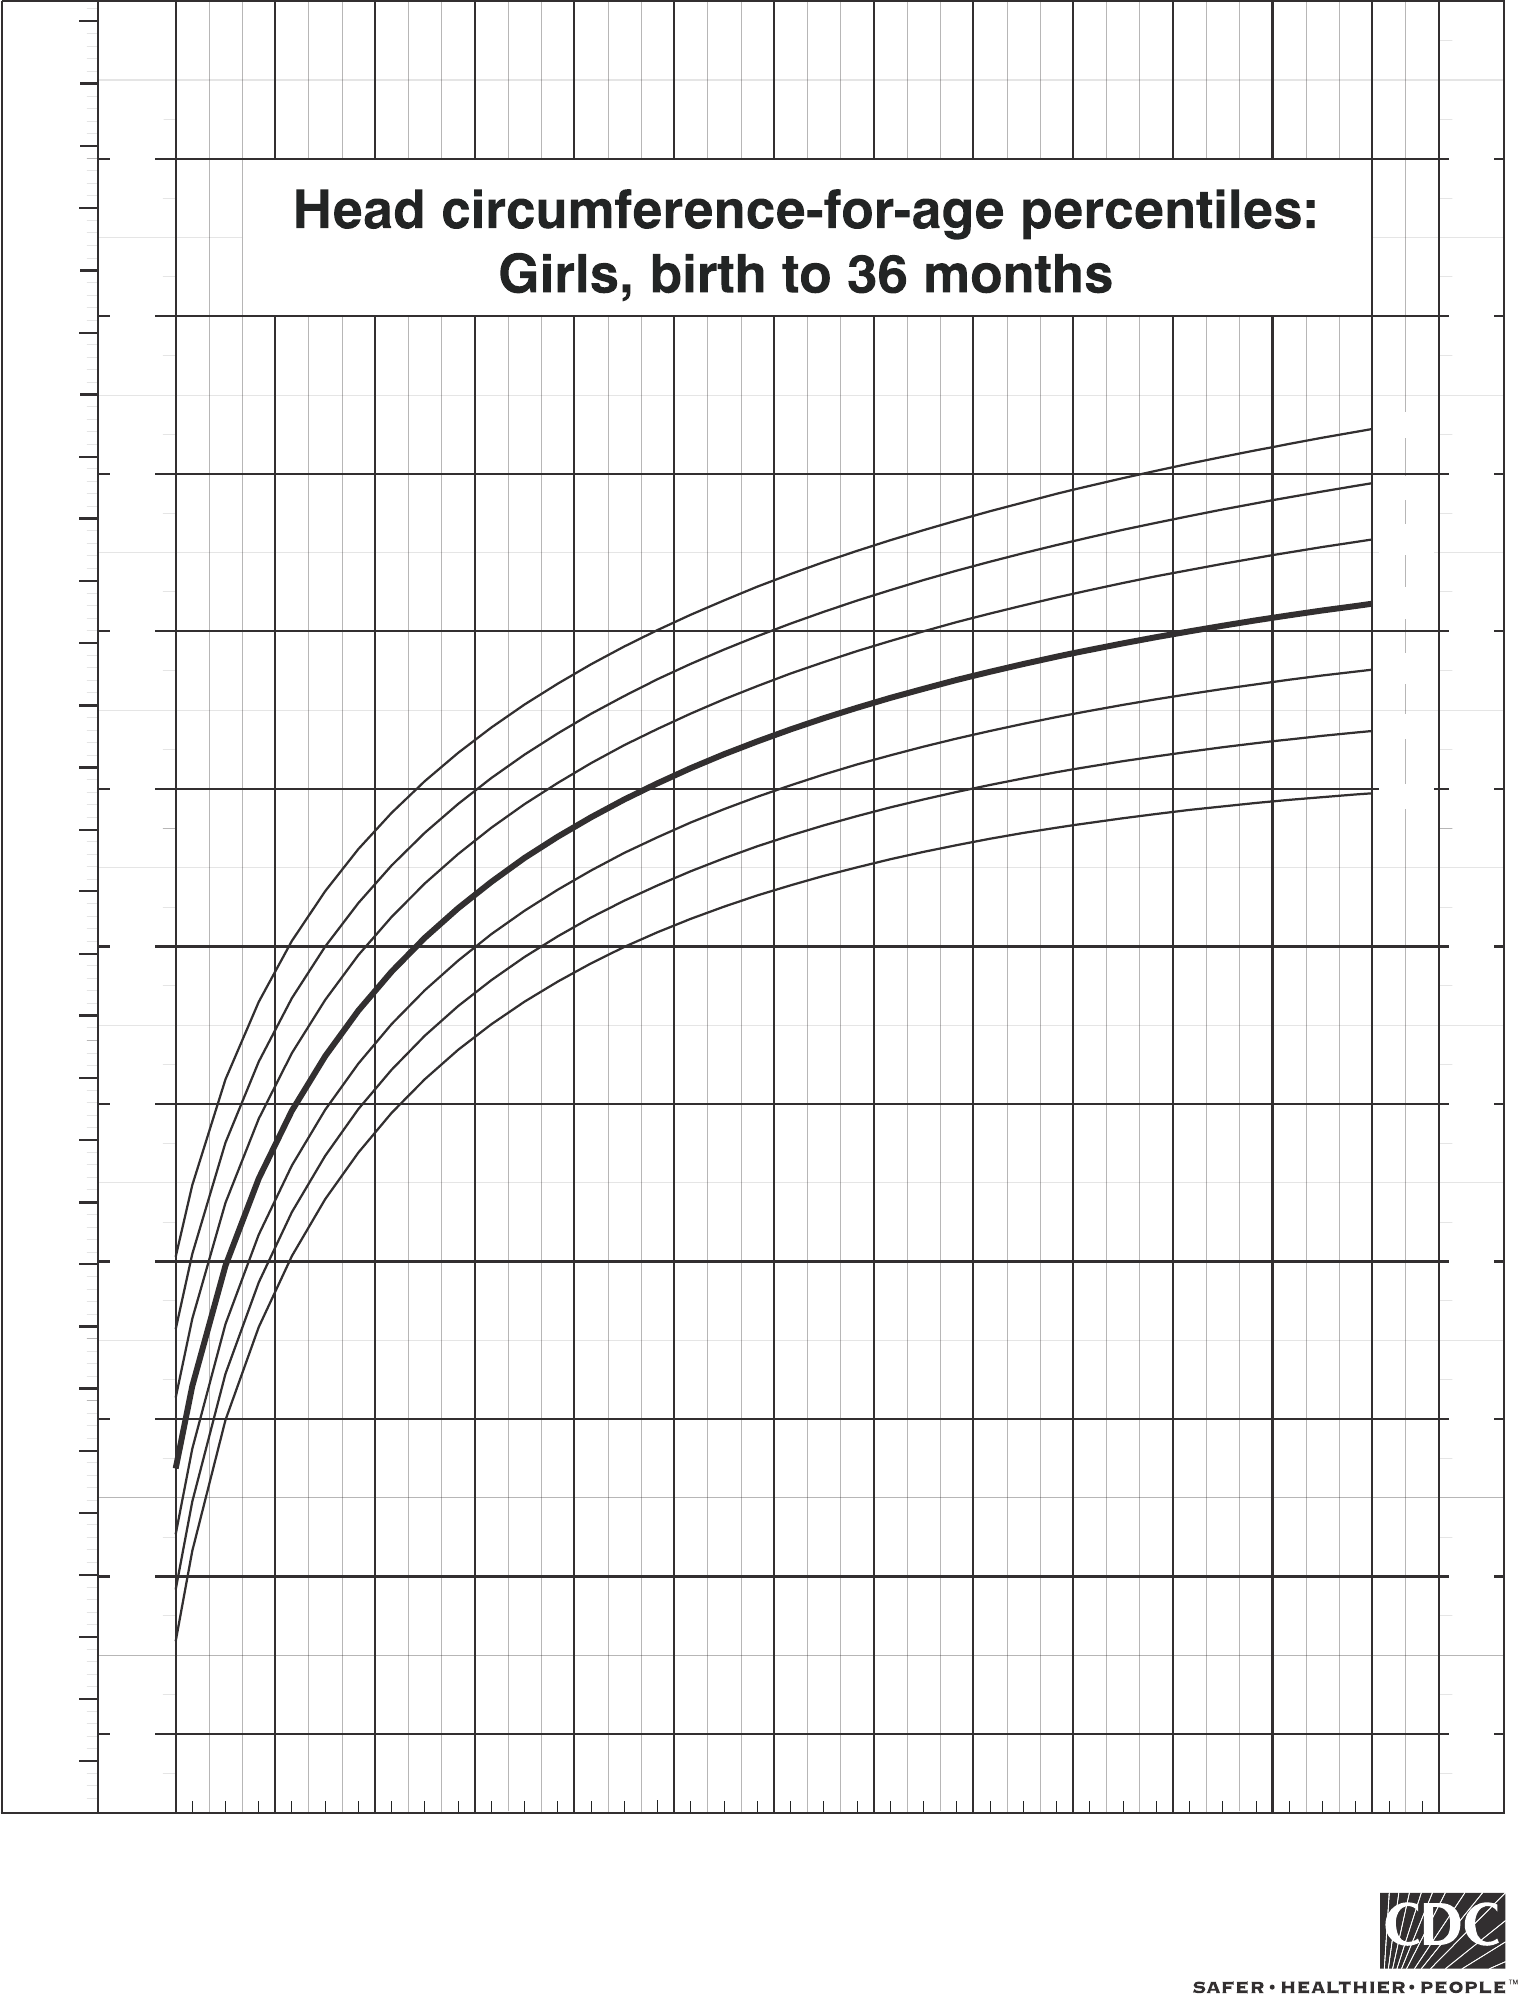
Age (months)
45
50
60
65
55
70
75
80
85
90
95
100
105
cm
cm
17
18
19
20
21
22
23
25
26
27
28
29
30
31
32
33
34
35
36
37
38
39
40
42
24
in
in
41
17
18
19
20
21
22
23
24
25
26
27
28
29
30
31
32
33
34
35
36
37
38
39
40
42
in
in
41
97th
90th
50th
25th
10th
3rd
75th
CDC Growth Charts: United States
SOURCE: Developed by the National Center for Health Statistics in collaboration with
the National Center for Chronic Disease Prevention and Health Promotion (2000).
Published May 30, 2000.
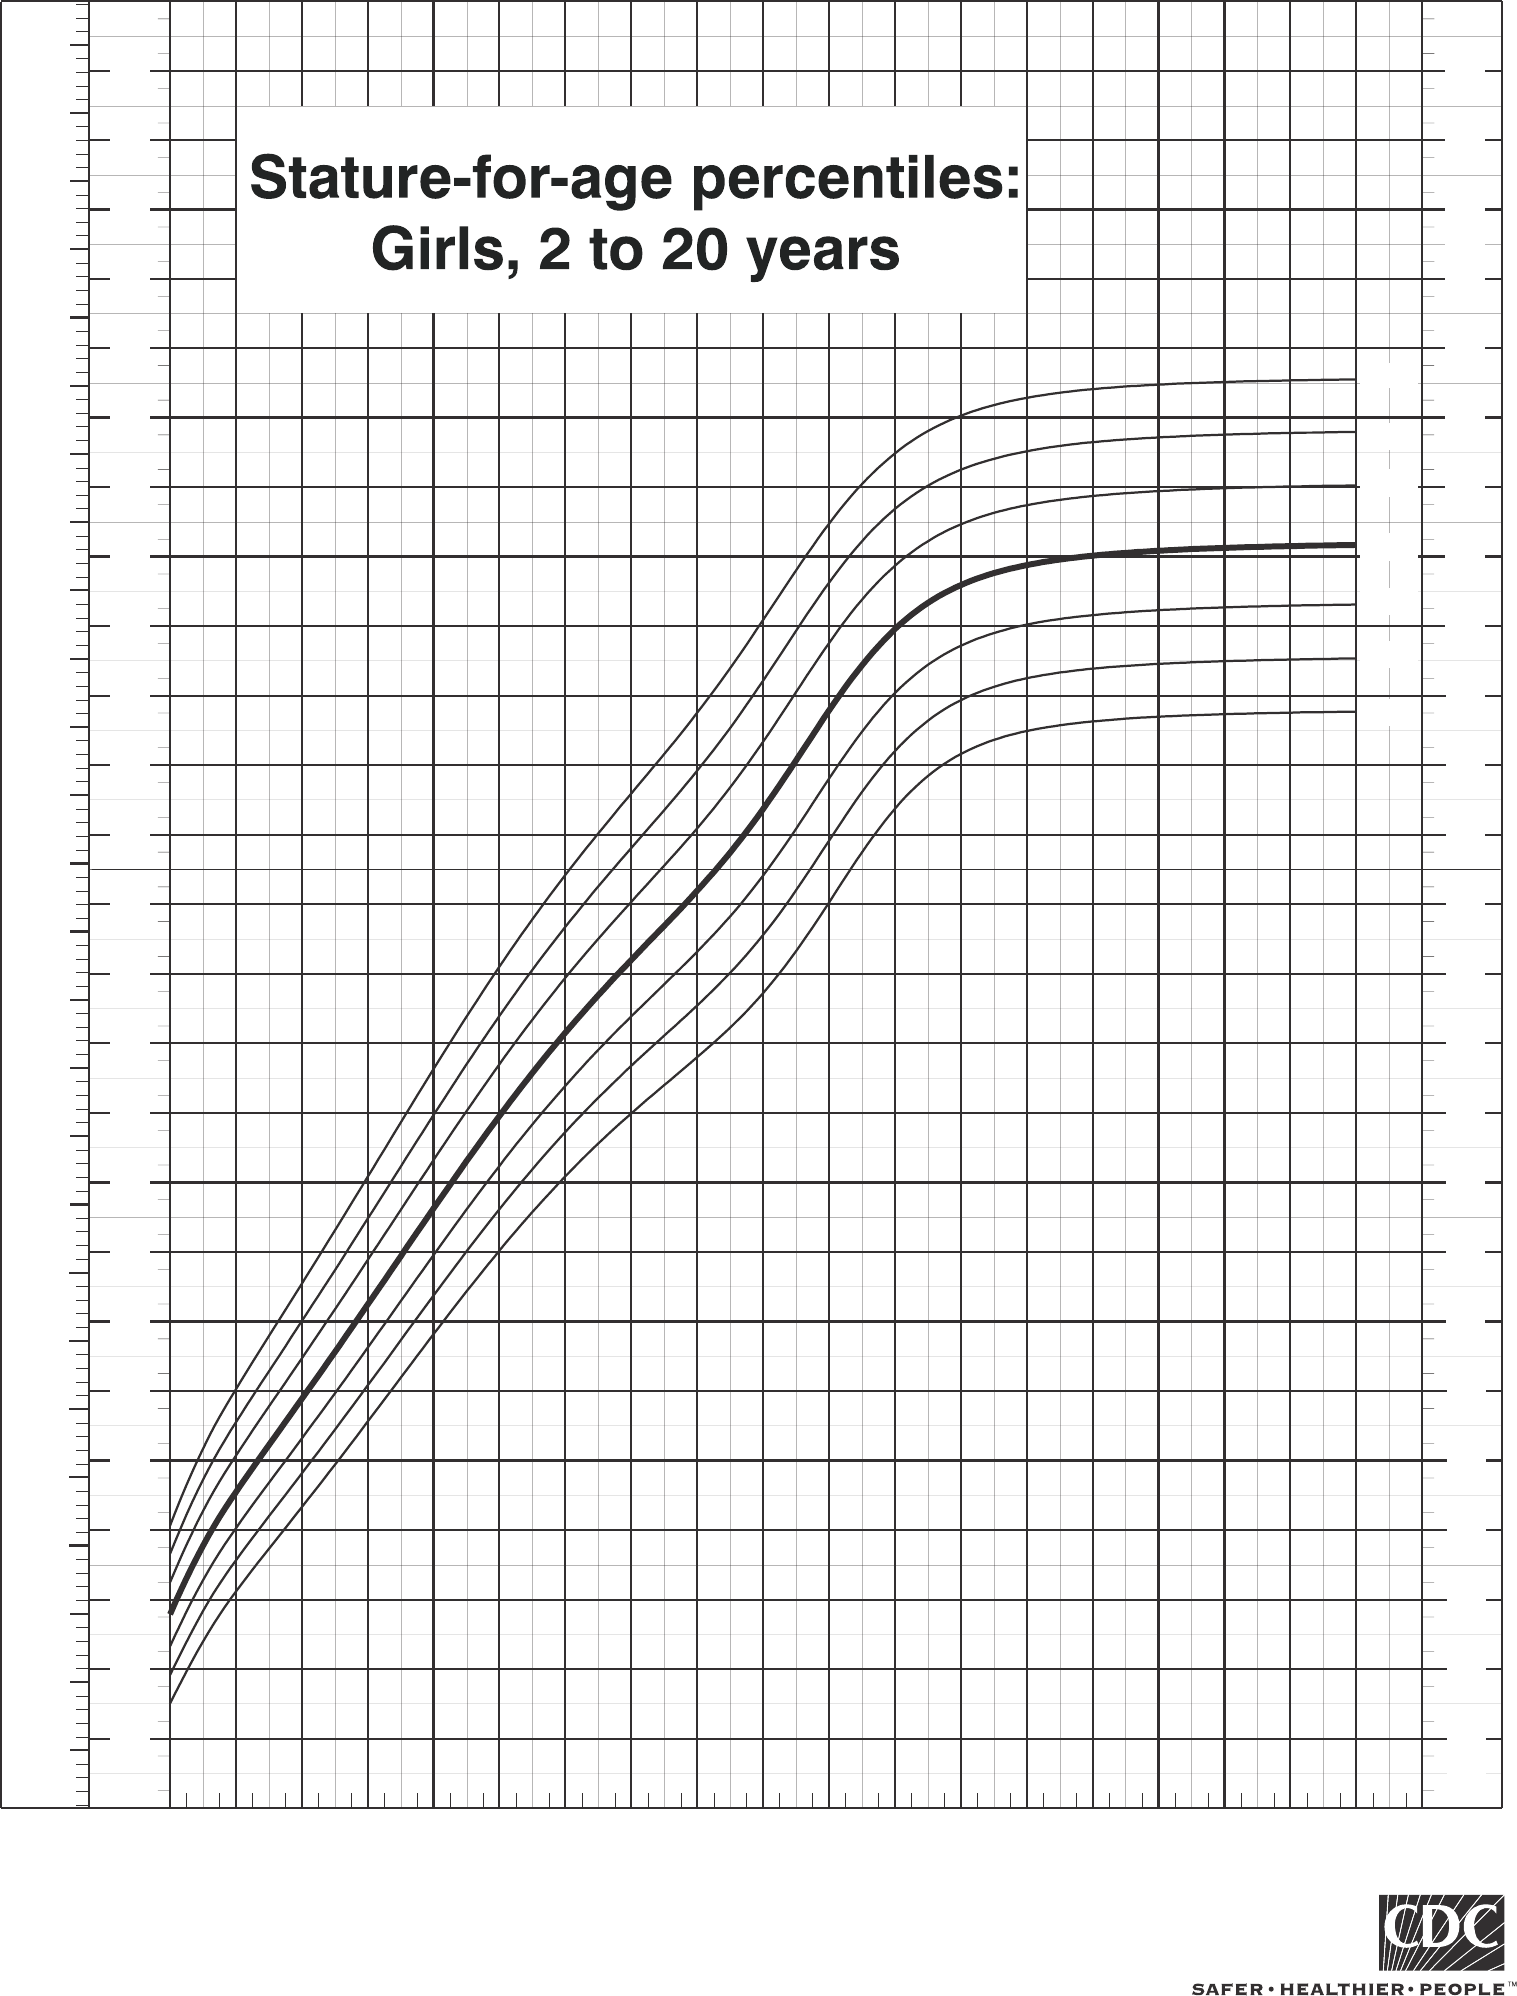
2 3 4 5 6 7 8 9 10 11 12 13 14 15 16 17 18 19 20
Age (years)
50th
25th
10th
3rd
75th
90th
97th
70
72
74
76
66
68
60
62
64
56
58
50
52
54
46
48
44
40
42
34
36
38
30
32
78
75
80
85
90
95
100
105
110
115
120
125
130
135
140
145
150
155
160
165
170
175
180
185
190
195
200
cm
cm
in
70
72
74
76
66
68
60
62
64
56
58
50
52
54
46
48
44
40
42
34
36
38
30
32
78
in
in
in
CDC Growth Charts: United States
SOURCE: Developed by the National Center for Health Statistics in collaboration with
the National Center for Chronic Disease Prevention and Health Promotion (2000).
Published May 30, 2000.
Birth 36912 15 18 21 24 27 30 33 36
Age (months)
50th
25th
10th
3rd
75th
90th
97th
34
32
30
40
38
36
44
42
50
48
46
54
52
56
cm
cm
in
12
13
14
15
16
19
20
21
22
18
17
in
in
12
13
14
15
16
19
20
21
22
18
17
in
CDC Growth Charts: United States
SOURCE: Developed by the National Center for Health Statistics in collaboration with
the National Center for Chronic Disease Prevention and Health Promotion (2000).
Published May 30, 2000.
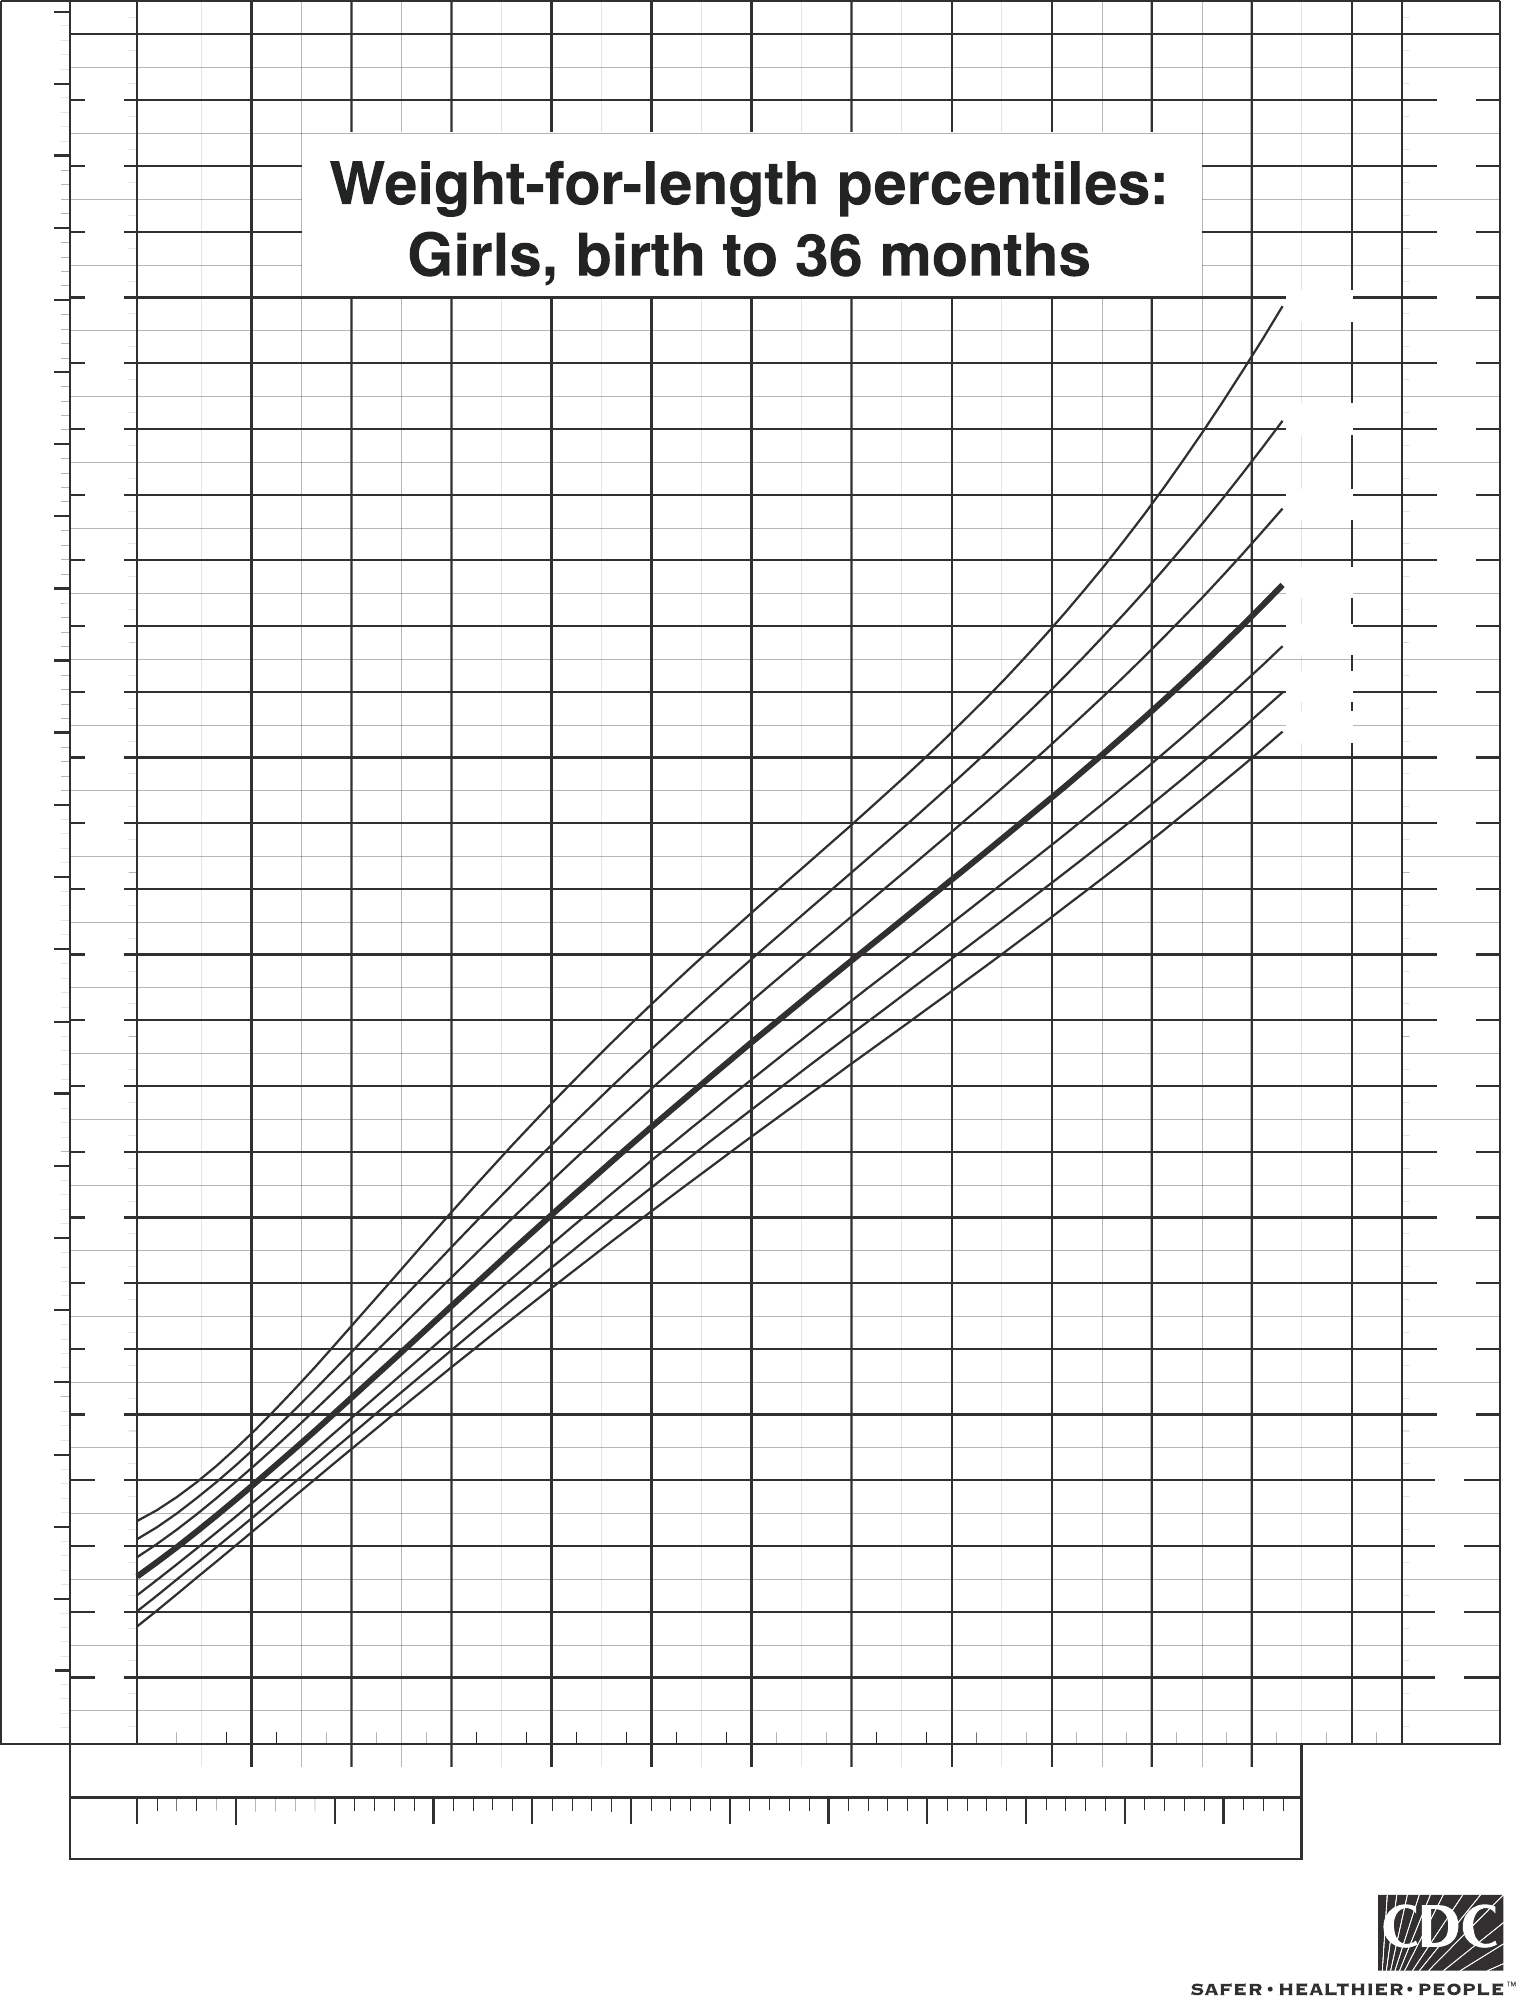
cm
Length
45 50 55 60 65 70 75 80 85 90 95 100
kg
2
1
4
3
6
5
8
7
10
9
12
14
13
11
16
15
18
17
19
20
21
22
23
kg
4
6
8
10
12
14
16
18
20
22
24
26
28
30
32
34
36
38
40
42
46
48
50
2
lb
lb
44
2
4
6
8
10
12
14
16
18
20
22
24
26
28
30
32
34
36
38
40
42
46
48
50
lb
lb
44
in
1918 20
21 22
23
24
25 26
27
28 29 30 31 32 33 34 35 36 37 38 4039
50th
25th
10th
3rd
75th
90th
97th
CDC Growth Charts: United States
SOURCE: Developed by the National Center for Health Statistics in collaboration with
the National Center for Chronic Disease Prevention and Health Promotion (2000).
Published May 30, 2000 (modified 6/8/00).

8580 90 95 100 105 110 115 120
cm
Stature
kg
11
10
9
8
12
13
14
15
16
17
18
19
20
21
22
23
24
25
26
27
28
29
30
31
32
33
34
kg
24
20
28
32
36
40
44
48
52
56
60
64
68
72
76
lb
lb
72
76
64
68
56
60
44
48
52
32
36
40
24
20
28
lb
lb
in
34 35 36 37 38 39 40 41 42 43 44 45 46 47333231
25th
50th
10th
3rd
75th
90th
85th
97th
CDC Growth Charts: United States
SOURCE: Developed by the National Center for Health Statistics in collaboration with
the National Center for Chronic Disease Prevention and Health Promotion (2000).
Published May 30, 2000 (modified 11/21/00).
23
45
6
7
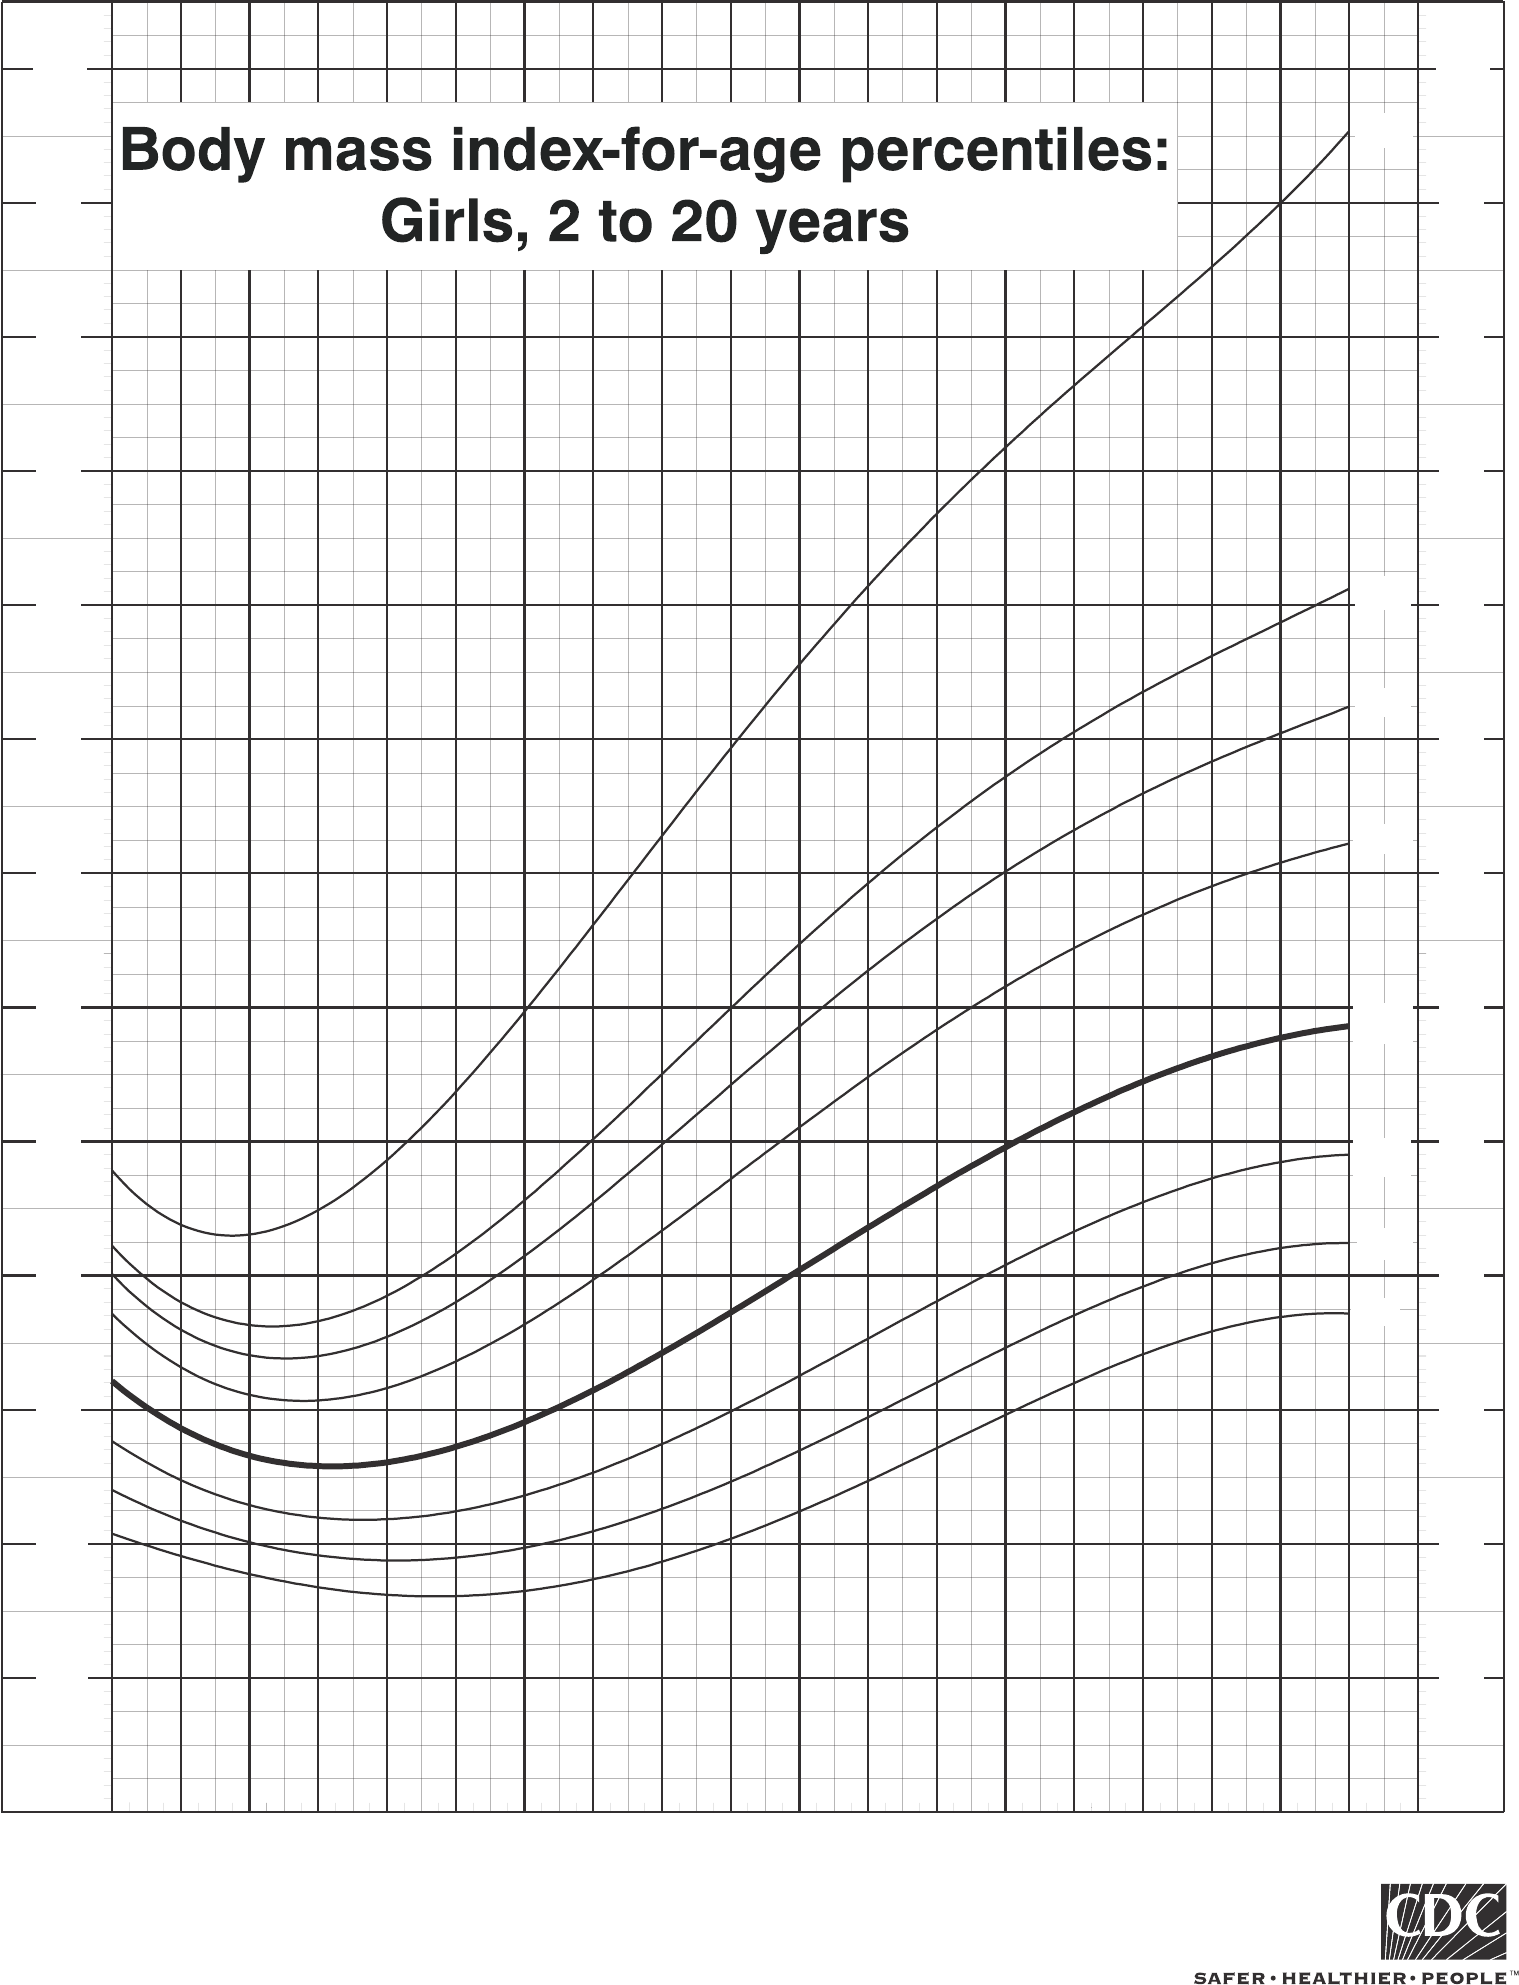
8 9 10 11 12 13
Age (years)
14 15 16 17 18 19 20
50th
25th
10th
3rd
75th
90th
97th
85th
kg/m²
12
14
16
18
20
22
24
26
28
30
32
34
kg/m²
32
34
12
14
16
18
20
22
24
26
28
30
BMI
BMI
CDC Growth Charts: United States
SOURCE: Developed by the National Center for Health Statistics in collaboration with
the National Center for Chronic Disease Prevention and Health Promotion (2000).
Published May 30, 2000.