Fillable Printable Dew Point Calculation Sample Chart
Fillable Printable Dew Point Calculation Sample Chart

Dew Point Calculation Sample Chart

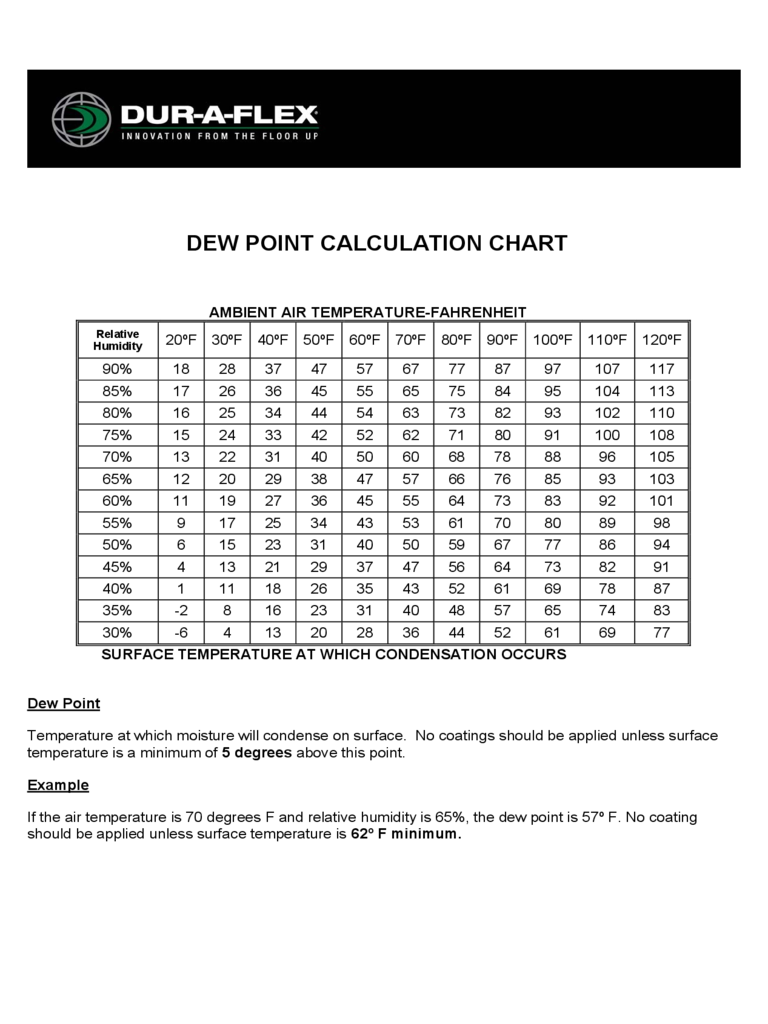
DEW POINT CALCULATION CHART
AMBIENT AIR TEMPERATURE-FAHRENHEIT
Relative
Humidity
20ºF 30ºF 40ºF 50ºF 60ºF 70ºF 80ºF 90ºF 100ºF 110ºF 120ºF
90% 18 28 37 47 57 67 77 87 97 107 117
85% 17 26 36 45 55 65 75 84 95 104 113
80% 16 25 34 44 54 63 73 82 93 102 110
75% 15 24 33 42 52 62 71 80 91 100 108
70% 13 22 31 40 50 60 68 78 88 96 105
65% 12 20 29 38 47 57 66 76 85 93 103
60% 11 19 27 36 45 55 64 73 83 92 101
55% 9 17 25 34 43 53 61 70 80 89 98
50% 6 15 23 31 40 50 59 67 77 86 94
45% 4 13 21 29 37 47 56 64 73 82 91
40% 1 11 18 26 35 43 52 61 69 78 87
35% -2 8 16 23 31 40 48 57 65 74 83
30% -6 4 13 20 28 36 44 52 61 69 77
SURFACE TEMPERATURE AT WHICH CONDENSATION OCCURS
Dew Point
Temperature at which moisture will condense on surface. No coatings should be applied unless surface
temperature is a minimum of 5 degrees above this point.
Example
If the air temperature is 70 degrees F and relative humidity is 65%, the dew point is 57º F. No coating
should be applied unless surface temperature is 62º F minimum.


