Fillable Printable International Standard Fetal Weight Chart
Fillable Printable International Standard Fetal Weight Chart
International Standard Fetal Weight Chart
Articles
861
the smoothed and observed centiles, independent of sex,
were negligible—0·71 g for birthweight; 0·02 cm for
length, and 0·001 cm for head circumference.
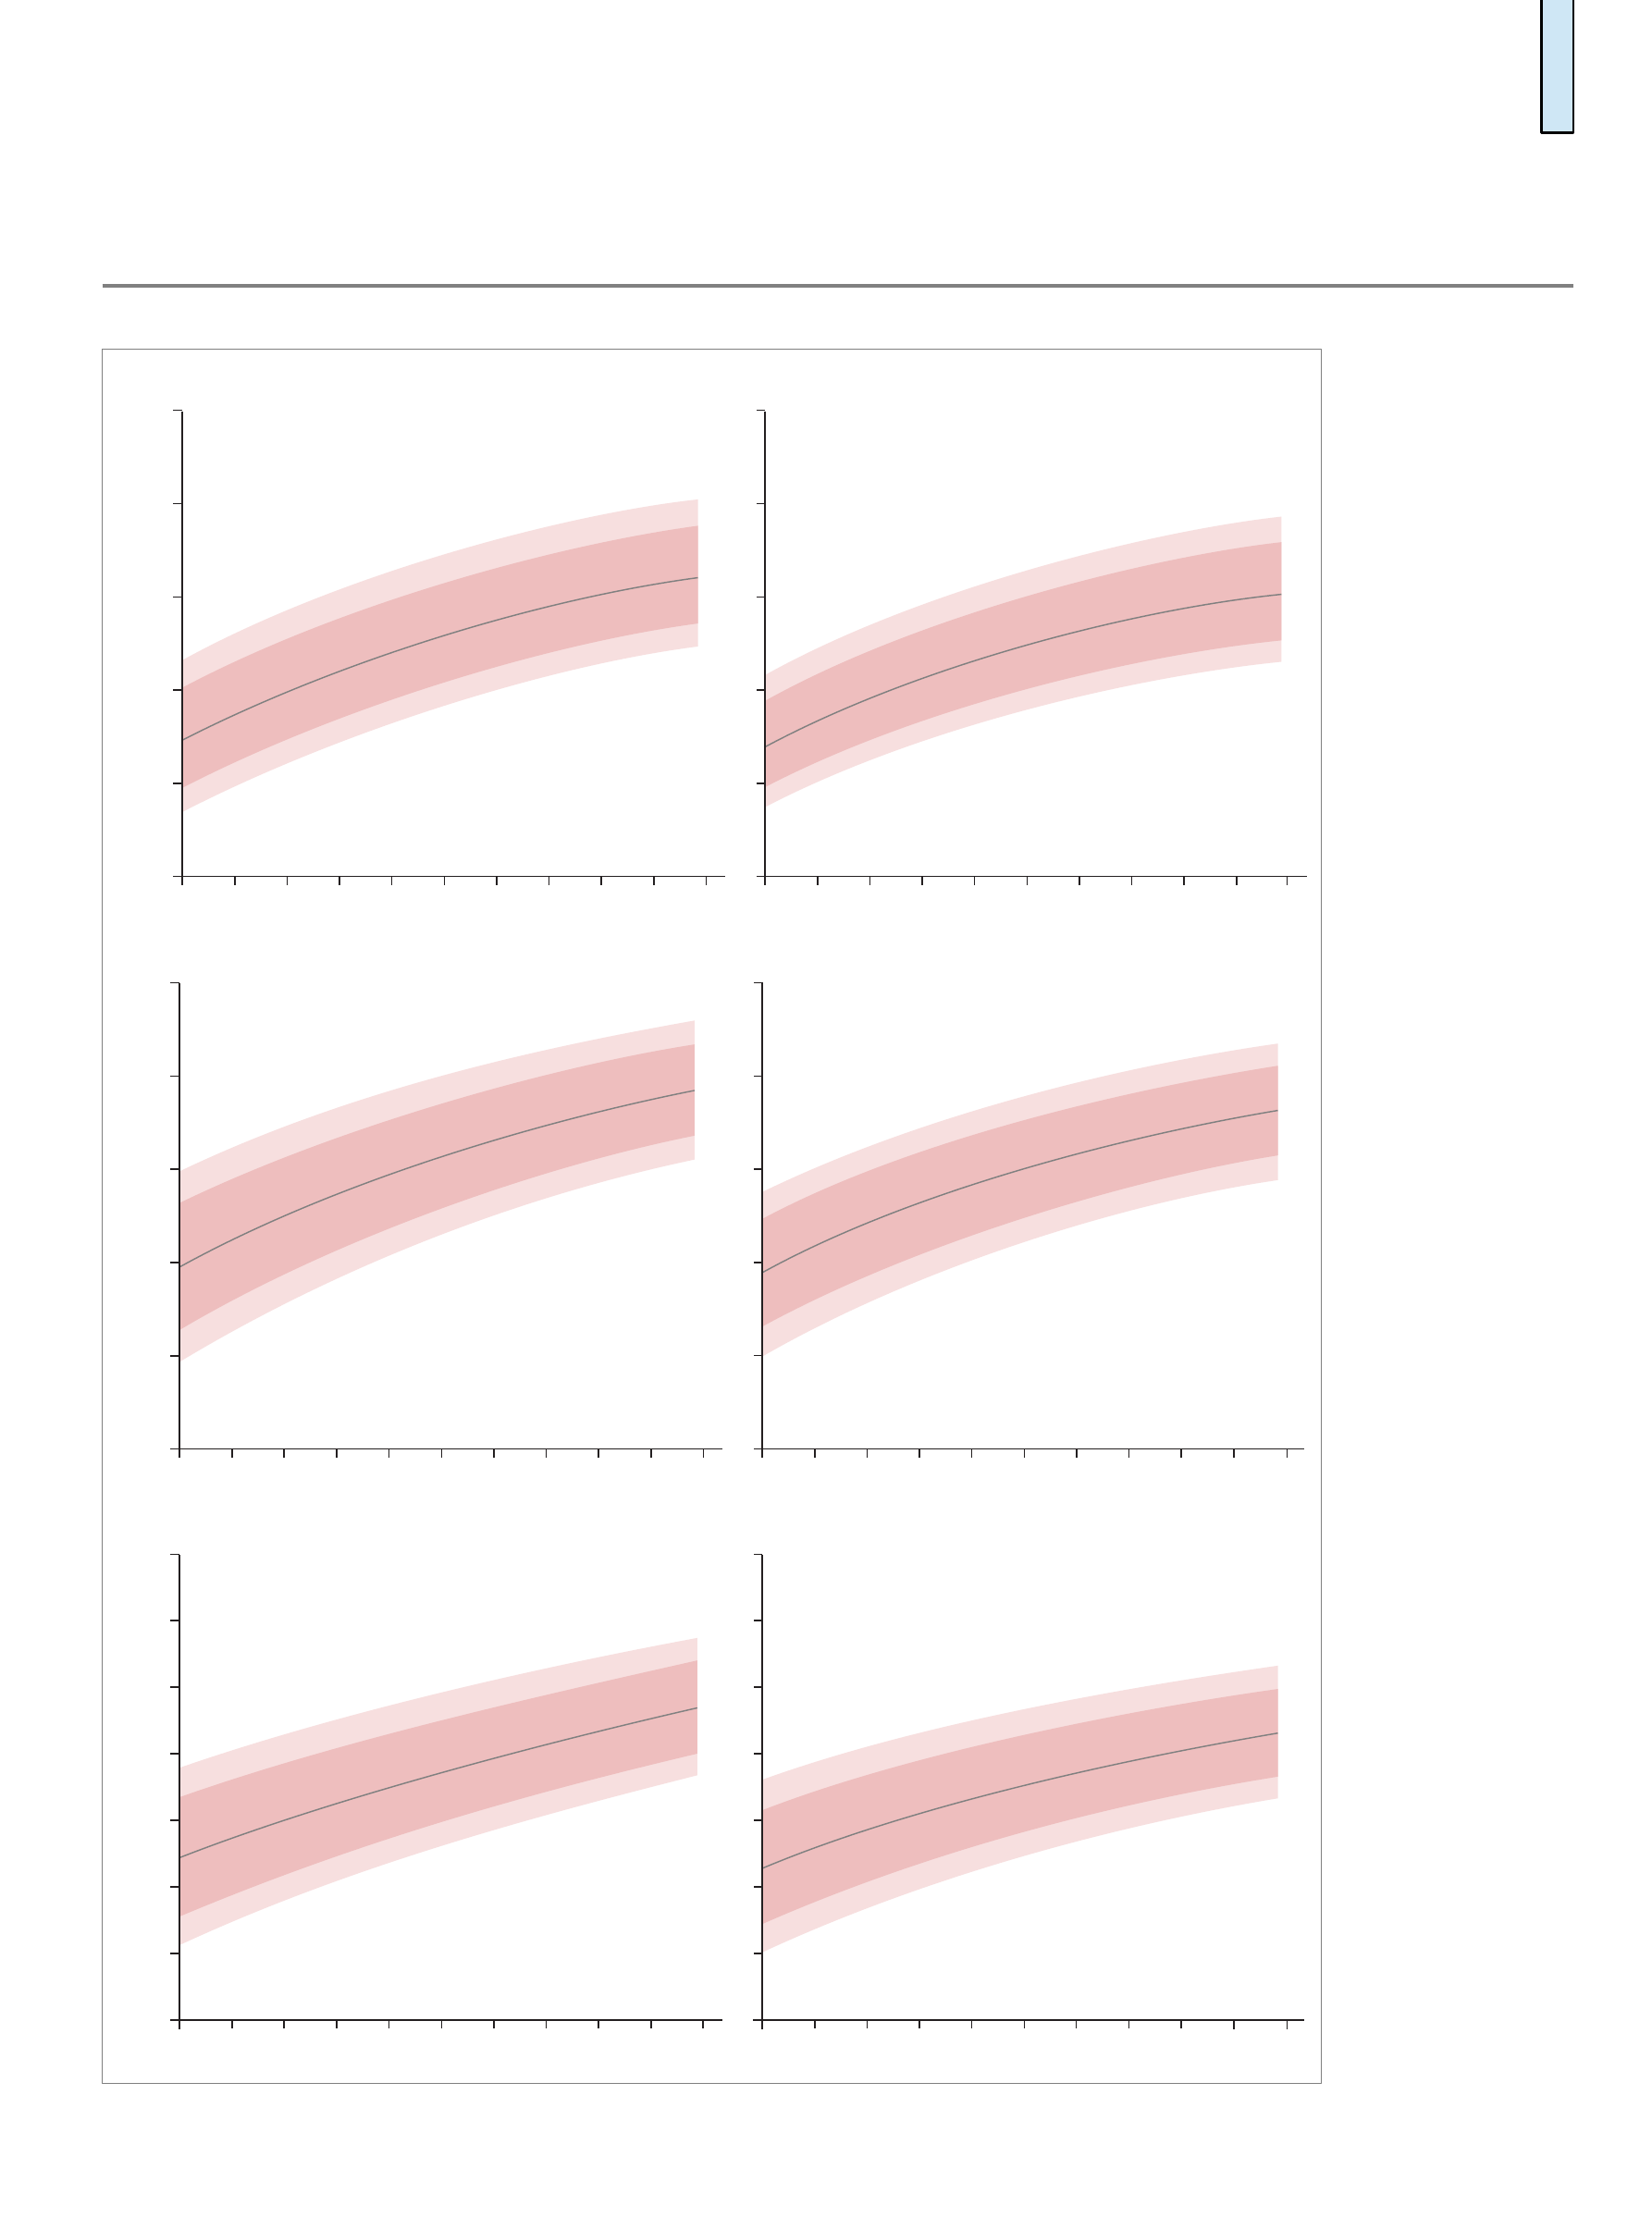
Figure 2 shows the 3rd, 10th, 50th, 90th, and 97th
smoothed centile curves for birthweight, length, and
head circumference according to gestational age and sex,
which represent the international standards for newborn
infants. For length and head circumference, the pattern
of growth increased steadily from 33 weeks of gestation
onwards. The curves for birthweight show a faster overall
increase as gestational age increases. Table 2, table 3, and
table 4 present the values for these centiles according to
gestational age and sex. Overall, boys were heavier,
longer, and had larger head circumferences than girls.
Brazil
(n=1595)
China
(n=3551)
India
(n=2493)
Italy
(n=2358)
Kenya
(n=3702)
Oman
(n=2821)
UK
(n=2939)
USA
(n=1027)
Total
(n=20 486)
Maternal age (years) 26·4 (4·8) 26·3 (3·0) 27·5 (3·3) 29·9 (4·0) 28·8 (3·5) 26·9 (4·0) 29·1 (4·3) 29·5 (3·9) 28·0 (4·0)
Maternal height (cm) 162·5 (5·4) 161·7 (4·5) 157·6 (3·3) 163·3 (5·6) 162·3 (5·5) 158·8 (4·1) 165·3 (6·1) 164·8 (6·2) 161·8 (5·6)
Maternal weight (kg) 63·2 (8·4) 58·8 (7·6) 57·0 (7·7) 60·4 (7·9) 63·6 (8·5) 60·7 (8·5) 64·4 (8·8) 63·7 (9·0) 61·3 (8·6)
Maternal body-mass
index (kg/m²)
23·9 (2·8) 22·5 (2·7) 22·9 (2·9) 22·6 (2·6) 24·1 (2·9) 24·1 (3·1) 23·5 (2·8) 23·4 (2·8) 23·4 (2·9)
Gestational age at first
visit (weeks)
14·0 (5·8) 16·2 (5·4) 14·3 (7·5) 13·1 (3·6) 17·1 (7·9) 15·2 (5·7) 13·2 (3·1) 12·0 (4·0) 14·8 (6·0)
Years of formal
education
11·3 (3·6) 13·9 (1·9) 16·2 (1·3) 13·7 (3·8) 14·9 (2·3) 13·2 (2·8) 16·0 (3·0) 16·5 (3·2) 14·2 (3·0)
Haemoglobin
concentration before
15 weeks’ gestation (g/L)
123 (9) 133 (10) 112 (11) 129 (10) 125 (14) 117 (11) 125 (9) 126 (9) 123 (12)
Married or cohabiting
(%)
1468 (92·0%) 3548 (99·9%) 2485 (99·7%) 2327 (98·7%) 3525 (95·2%) 2821 (100%) 2762 (94·0%) 941 (91·6%) 19 877 (97·0%)
Nulliparous (%) 998 (62·6%) 3320 (93·5%) 1719 (69·0%) 1472 (62·4%) 1877 (50·7%) 1228 (43·5%) 1753 (59·6%) 629 (61·2%) 12 996 (63·4%)
Pre-eclampsia (%) 23 (1·4%) 49 (1·4%) 6 (0·2%) 13 (0·6%) 40 (1·1%) 8 (0·3%) 102 (3·5%) 15 (1·5%) 256 (1·2%)
Pyelonephritis (%) 25 (1·6%) 0 0 4 (0·2%) 16 (0·4%) 3 (0·1%) 2 (0·1%) 4 (0·4%) 54 (0·3%)
Maternal sexually
transmitted infection
(%)
20 (1·3%) 0 0 8 (0·3%) 2 (0·1%) 0 2 (0·1%) 36 (3·5%) 68 (0·3%)
Spontaneous initiation
of labour (%)
850 (53·3%) 1390 (39·1%) 1528 (61·3%) 1985 (84·2%) 2482 (67·0%) 2494 (88·4%) 2025 (68·9%) 716 (69·7%) 13 470 (65·8%)
PPROM (<37 weeks; %) 62 (3·9%) 65 (1·8%) 48 (1·9%) 24 (1·0%) 47 (1·3%) 35 (1·2%) 37 (1·3%) 20 (1·9%) 338 (1·6%)
Caesarean section (%) 1040 (65·2%) 2077 (58·5%) 1516 (60·8%) 488 (20·7%) 1187 (32·1%) 395 (14·0%) 513 (17·5%) 236 (23·0%) 7452 (36·4%)
NICU admission longer
than 1 day (%)
143 (9·0%) 438 (12·3%) 93 (3·7%) 56 (2·4%) 143 (3·9%) 152 (5·4%) 108 (3·7%) 51 (5·0%) 1184 (5·8%)
Preterm birth
(<37 weeks; %)
143 (9·0%) 212 (6·0%) 250 (10·0%) 83 (3·5%) 154 (4·2%) 145 (5·1%) 100 (3·4%) 49 (4·8%) 1136 (5·5%)
Preterm birth after
spontaneous onset of
labour (%)
79 (5·0%) 87 (2·5%) 111 (4·5%) 55 (2·3%) 91 (2·5%) 113 (4·0%) 57 (1·9%) 41 (4·0%) 634 (3·1%)
Term* low birthweight
(<2500 g; %)
31 (1·9%) 22 (0·6%) 222 (8·9%) 50 (2·1%) 134 (3·6%) 126 (4·5%) 49 (1·7%) 17 (1·7%) 651 (3·2%)
All low birthweight
(<2500 g; %)
92 (5·8%) 75 (2·1%) 338 (13·6%) 91 (3·9%) 206 (5·6%) 183 (6·5%) 100 (3·4%) 44 (4·3%) 1129 (5·5%)
Neonatal mortality (%) 4 (0·3%) 0 4 (0·2%) 0 9 (0·2%) 4 (0·1%) 0 1 (0·1%) 22 (0·1%)
Boys (%) 823 (51·6%) 1861 (52·4%) 1287 (51·6%) 1173 (49·7%) 1850 (50·0%) 1471 (52·2%) 1471 (50·1%) 546 (53·2%) 10 482 (51·2%)
Exclusive breastfeeding
at hospital discharge (%)
1499 (94·0%) 2870 (80·8%) 2455 (98·5%) 1720 (72·9%) 3616 (97·7%) 2736 (97·0%) 2281 (77·6%) 815 (79·4%) 17 992 (87·8%)
Mother admitted to
intensive care unit (%)
3 (0·2%) 2 (0·1%) 1 7 (0·3%) 5 (0·1%) 18 (0·6%) 1 1 (0·1%) 38 (0·2%)
Term* birthweight (kg) 3·3 (0·4) 3·4 (0·4) 2·9 (0·4) 3·3 (0·4) 3·3 (0·4) 3·1 (0·4) 3·5 (0·5) 3·4 (0·5) 3·3 (0·5)
Term* birthlength (cm) 49·0 (1·7) 49·7 (1·6) 48·6 (1·8) 49·4 (1·7) 49·1 (1·8) 49·0 (1·8) 49·9 (1·9) 49·9 (2·2) 49·3 (1·8)
Term* birth head
circumference (cm)
34·2 (1·2) 33·6 (1·2) 33·1 (1·1) 34·0 (1·2) 34·2 (1·2) 33·6 (1·1) 34·5 (1·3) 34·5 (1·4) 33·9 (1·3)
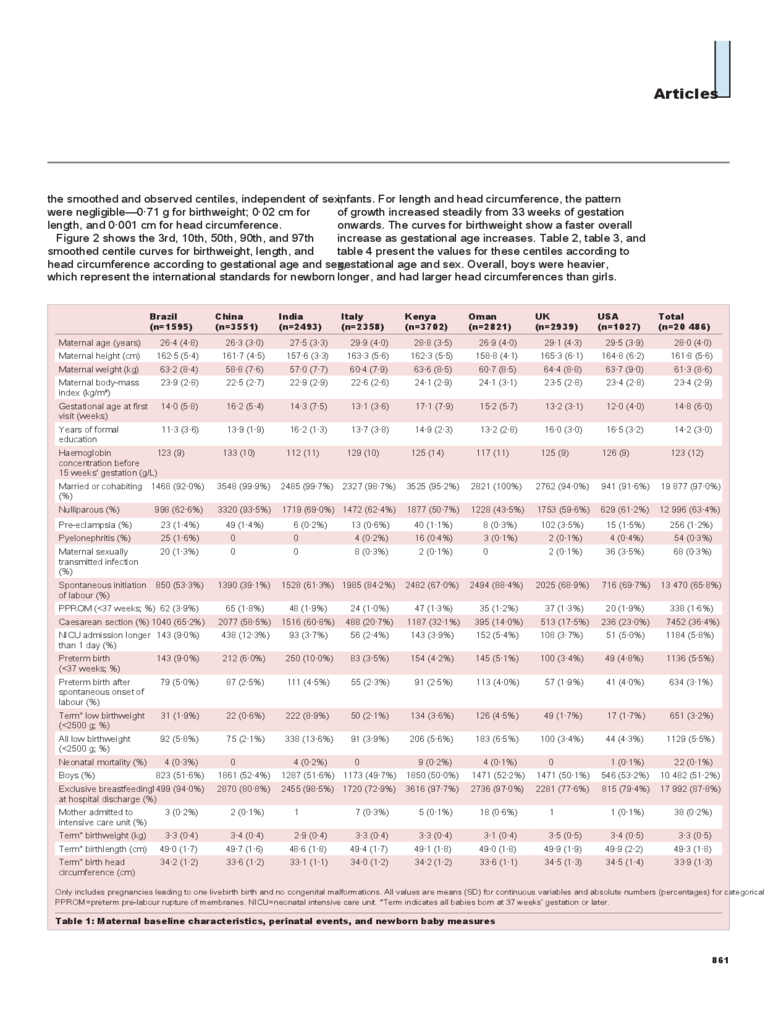
Only includes pregnancies leading to one livebirth birth and no congenital malformations. All values are means (SD) for continuous variables and absolute numbers (percentages) for categorical variables.
PPROM=preterm pre-labour rupture of membranes. NICU=neonatal intensive care unit. *Term indicates all babies born at 37 weeks’ gestation or later.
Table 1: Maternal baseline characteristics, perinatal events, and newborn baby measures
Articles
862
0·5
1·5
2·5
3·5
4·5
5·5
36
40
44
48
52
56
26
28
30
32
34
40
38
36
Birthweight (kg)
A
Birthweight
Birth length
Head circumference
GirlsBoys
GirlsBoys
GirlsBoys
Length (cm)
B
33 34 35 36 37 38 39 40 41 42 43
Head circumference (cm)
Gestational age (weeks)
C
33 34 35 36 37 38 39 40 41 42 43
Gestational age (weeks)
33 34 35 36 37 38 39 40 41 42 43
Gestational age (weeks)
33 34 35 36 37 38 39 40 41 42 43
Gestational age (weeks)
33 34 35 36 37 38 39 40 41 42 43
Gestational age (weeks)
33 34 35 36 37 38 39 40 41 42 43
Gestational age (weeks)
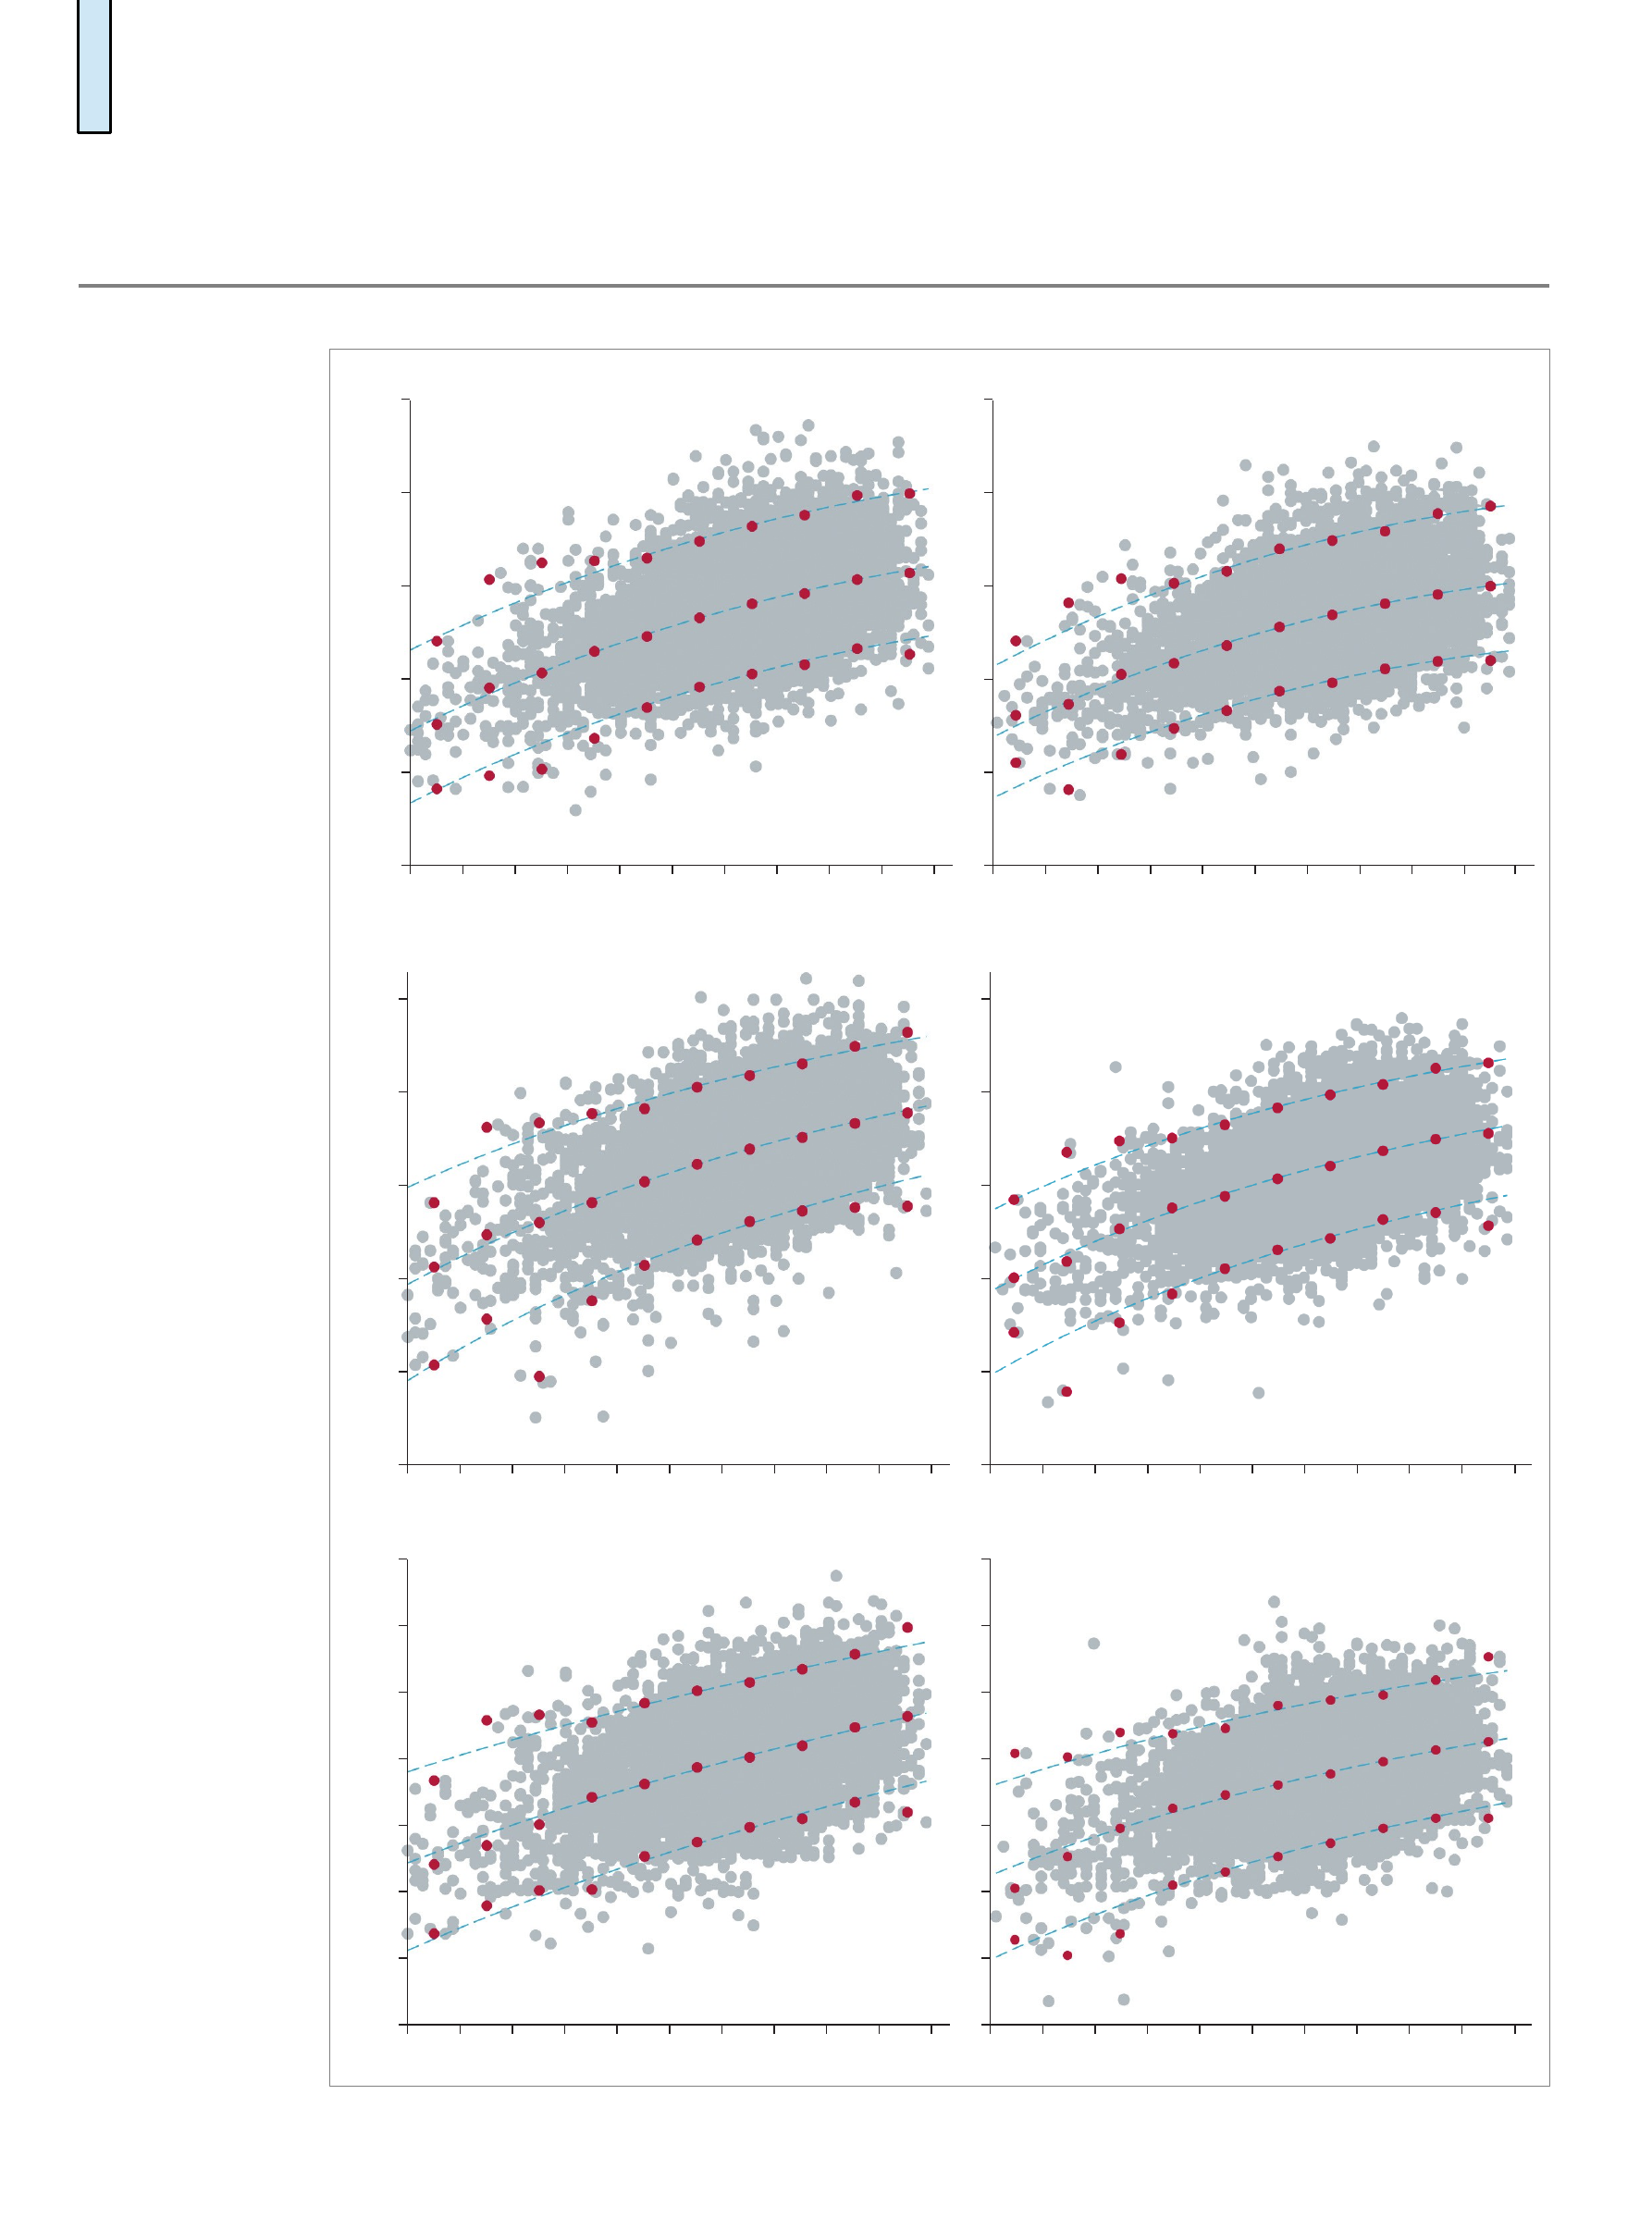
Figure 1: Fitted 3rd, 50th,
and 97th smoothed centile
curves (blue lines) for (A)
birthweight, (B) birth
length, and (C) head
circumference according to
gestational age
Shows empirical values for
each week of gestation
(red circles) and the actual
observations (grey circles).
Articles
863
0·5
1·5
2·5
3·5
4·5
5·5
36
40
44
48
52
56
26
28
30
32
34
40
38
36
Birthweight (kg)
A
Birthweight
Birth length
Head circumference
GirlsBoys
GirlsBoys
GirlsBoys
Length (cm)
B
33 34 35 36 37 38 39 40 41 42 43
Head circumference (cm)
Gestational age (weeks)
C
33 34 35 36 37 38 39 40 41 42 43
Gestational age (weeks)
33 34 35 36 37 38 39 40 41 42 43
Gestational age (weeks)
33 34 35 36 37 38 39 40 41 42 43
Gestational age (weeks)
33 34 35 36 37 38 39 40 41 42 43
Gestational age (weeks)
33 34 35 36 37 38 39 40 41 42 43
Gestational age (weeks)
Figure 2: The 3rd, 10th, 50th,
90th, and 97th smoothed
centile curves for (A)
birthweight, (B) birth
length, and (C) head
circumference according to
gestational age

Articles
864
Boys Girls
Number of
observations
Centiles for birthweight (kg) Number of
observations
Centiles for birthweight (kg)
3rd 10th 50th 90th 97th 3rd 10th 50th 90th 97th
33 weeks 34 1·18 1·43 1·95 2·52 2·82 17 1·20 1·41 1·86 2·35 2·61
34 weeks 48 1·45 1·71 2·22 2·79 3·08 65 1·47 1·68 2·13 2·64 2·90
35 weeks 128 1·70 1·95 2·47 3·03 3·32 114 1·71 1·92 2·38 2·89 3·16
36 weeks 323 1·93 2·18 2·69 3·25 3·54 293 1·92 2·14 2·60 3·12 3·39
37 weeks 857 2·13 2·38 2·89 3·45 3·74 803 2·11 2·33 2·80 3·32 3·60
38 weeks 2045 2·32 2·57 3·07 3·63 3·92 1802 2·28 2·50 2·97 3·51 3·78
39 weeks 3009 2·49 2·73 3·24 3·79 4·08 2869 2·42 2·65 3·13 3·66 3·94
40 weeks 2568 2·63 2·88 3·38 3·94 4·22 2523 2·55 2·78 3·26 3·80 4·08
41 weeks 1179 2·76 3·01 3·51 4·06 4·35 1195 2·65 2·89 3·37 3·92 4·20
42 weeks 206 2·88 3·12 3·62 4·17 4·46 224 2·74 2·98 3·46 4·01 4·30
Total 10 397 ·· ·· ·· ·· ·· 9905 ·· ·· ·· ·· ··
Table 2: Smoothed centiles for birthweight of boys and girls according to gestational age
Boys Girls
Number of
observations
Centiles for length (cm) Number of
observations
Centiles for length (cm)
3rd 10th 50th 90th 97th 3rd 10th 50th 90th 97th
33 weeks 33 39·69 41·09 43·81 46·55 47·97 17 39·79 41·01 43·39 45·70 46·85
34 weeks 48 41·05 42·38 44·98 47·59 48·94 65 41·04 42·22 44·55 46·79 47·92
35 weeks 128 42·26 43·54 46·03 48·53 49·82 111 42·14 43·30 45·57 47·76 48·86
36 weeks 320 43·36 44·58 46·97 49·38 50·62 292 43·13 44·26 46·48 48·62 49·69
37 weeks 849 44·34 45·52 47·82 50·14 51·34 799 44·01 45·11 47·29 49·39 50·44
38 weeks 2031 45·22 46·37 48·59 50·83 51·99 1786 44·79 45·88 48·01 50·07 51·10
39 weeks 2983 46·02 47·13 49·29 51·46 52·59 2846 45·49 46·56 48·65 50·68 51·69
40 weeks 2531 46·75 47·83 49·92 52·03 53·13 2486 46·12 47·17 49·23 51·23 52·22
41 weeks 1146 47·41 48·46 50·50 52·56 53·62 1180 46·68 47·72 49·75 51·72 52·70
42 weeks 202 48·01 49·04 51·03 53·03 54·07 218 47·19 48·21 50·22 52·15 53·12
Total 10 271 ·· ·· ·· ·· ·· 9800 ·· ·· ·· ·· ··
Table 3: Smoothed centiles for birth length of boys and girls according to gestational age
Boys Girls
Number of
observations
Centiles for head circumference (cm) Number of
observations
Centiles for head circumference (cm)
3rd 10th 50th 90th 97th 3rd 10th 50th 90th 97th
33 weeks 33 28·25 29·11 30·88 32·71 33·62 17 27·92 28·76 30·46 32·24 33·14
34 weeks 48 28·93 29·76 31·47 33·23 34·11 65 28·64 29·44 31·08 32·78 33·65
35 weeks 127 29·56 30·37 32·02 33·73 34·58 111 29·28 30·06 31·64 33·28 34·12
36 weeks 322 30·15 30·93 32·53 34·19 35·02 293 29·87 30·62 32·14 33·74 34·55
37 weeks 848 30·69 31·46 33·02 34·63 35·43 798 30·40 31·13 32·61 34·15 34·94
38 weeks 2032 31·21 31·95 33·47 35·04 35·83 1783 30·88 31·59 33·03 34·53 35·30
39 weeks 2985 31·69 32·42 33·90 35·44 36·20 2849 31·32 32·01 33·41 34·88 35·62
40 weeks 2532 32·15 32·86 34·31 35·81 36·56 2486 31·72 32·39 33·76 35·19 35·92
41 weeks 1147 32·58 33·28 34·70 36·17 36·91 1180 32·08 32·74 34·08 35·48 36·19
42 weeks 204 32·99 33·68 35·07 36·52 37·24 218 32·41 33·06 34·37 35·74 36·44
Total 10 278 ·· ·· ·· ·· ·· 9800 ·· ·· ·· ·· ··
Table 4: Smoothed centiles for head circumference of boys and girls according to gestational age