Fillable Printable Root Cause Analysis For Beginners
Fillable Printable Root Cause Analysis For Beginners
Root Cause Analysis For Beginners

QUALITY PROGRESS
I
JULY 2004
I
45
Root Cause Analysis
For
Beginners
by James J. Rooney and Lee N. Vanden Heuvel
oot cause analysis (RCA) is a process
designed for use in investigating and cate-
gorizing the root causes of events with safe-
ty, health, environmental, quality, reliability and
production impacts. The term “event” is used to
generically identify occurrences that produce or
have the potential to produce these types of conse-
quences.
Simply stated, RCA is a tool designed to help
identify not only what and how an event occurred,
but also why it happened. Only when investiga-
tors are able to determine why an event or failure
occurred will they be able to specify workable
corrective measures that prevent future events of
the type observed.
Understanding why an event occurred is the
key to developing effective recommendations.
Imagine an occurrence during which an opera-
tor is instructed to close valve A; instead, the
operator closes valve B. The typical investiga-
tion would probably conclude operator error
was the cause.
This is an accurate description of what hap-
pened and how it happened. However, if the ana-
lysts stop here, they have not probed deeply
enough to understand the reasons for the mistake.
Therefore, they do not know what to do to pre-
vent it from occurring again.
In the case of the operator who turned the
wrong valve, we are likely to see recommenda-
tions such as retrain the operator on the proce-
dure, remind all operators to be alert when
R
QUALITY BASICS
In 50 Words
Or Less
• Root cause analysis helps identify what, how
and why something happened, thus preventing
recurrence.
• Root causes are underlying, are reasonably
identifiable, can be controlled by management
and allow for generation of recommendations.
• The process involves data collection, cause
charting, root cause identification and recom-
mendation generation and implementation.

manipulating valves or emphasize to all personnel
that careful attention to the job should be main-
tained at all times. Such recommendations do little
to prevent future occurrences.
Generally, mistakes do not just happen but can
be traced to some well-defined causes. In the case
of the valve error, we might ask, “Was the proce-
dure confusing? Were the valves clearly labeled?
Was the operator familiar with this particular
task?”
The answers to these and other questions will
help determine why the error took place and
what the organization can do to prevent recur-
rence. In the case of the valve error, example
recommendations might include revising the
procedure or performing procedure validation to
ensure references to valves match the valve labels
found in the field.
Identifying root causes is the key to preventing
similar recurrences. An added benefit of an effective
RCA is that, over time, the root causes identified
across the population of occurrences can be used to
target major opportunities for improvement.
If, for example, a significant number of analyses
point to procurement inadequacies, then resources
can be focused on improvement of this management
system. Trending of root causes allows development
of systematic improvements and assessment of the
impact of corrective programs.
Definition
Although there is substantial debate on the defi-
nition of root cause, we use the following:
1. Root causes are specific underlying causes.
2. Root causes are those that can reasonably be
identified.
3. Root causes are those management has control
to fix.
4. Root causes are those for which effective rec-
ommendations for preventing recurrences can
be generated.
Root causes are underlying causes. The investi-
gator’s goal should be to identify specific underly-
ing causes. The more specific the investigator can
be about why an event occurred, the easier it will
be to arrive at recommendations that will prevent
recurrence.
Root causes are those that can reasonably be
identified. Occurrence investigations must be cost
beneficial. It is not practical to keep valuable man-
power occupied indefinitely searching for the root
causes of occurrences. Structured RCA helps ana-
lysts get the most out of the time they have invest-
ed in the investigation.
Root causes are those over which management
has control. Analysts should avoid using general
cause classifications such as operator error, equip-
ment failure or external factor. Such causes are not
specific enough to allow management to make
effective changes. Management needs to know
exactly why a failure occurred before action can be
taken to prevent recurrence.
We must also identify a root cause that manage-
ment can influence. Identifying “severe weather”
as the root cause of parts not being delivered on
time to customers is not appropriate. Severe weath-
er is not controlled by management.
Root causes are those for which effective recom-
mendations can be generated. Recommendations
should directly address the root causes identified
during the investigation. If the analysts arrive at
vague recommendations such as, “Improve adher-
ence to written policies and procedures,” then
they probably have not found a basic and specific
enough cause and need to expend more effort in the
analysis process.
Four Major Steps
The RCA is a four-step process involving the fol-
lowing:
1. Data collection.
2. Causal factor charting.
46
I
JULY 2004
I
www.asq.org
QUALITY BASICS
Identifying “severe weather”
as the root cause of parts not
being delivered on time to
customers is not appropriate.
QUALITY PROGRESS
I
JULY 2004
I
47
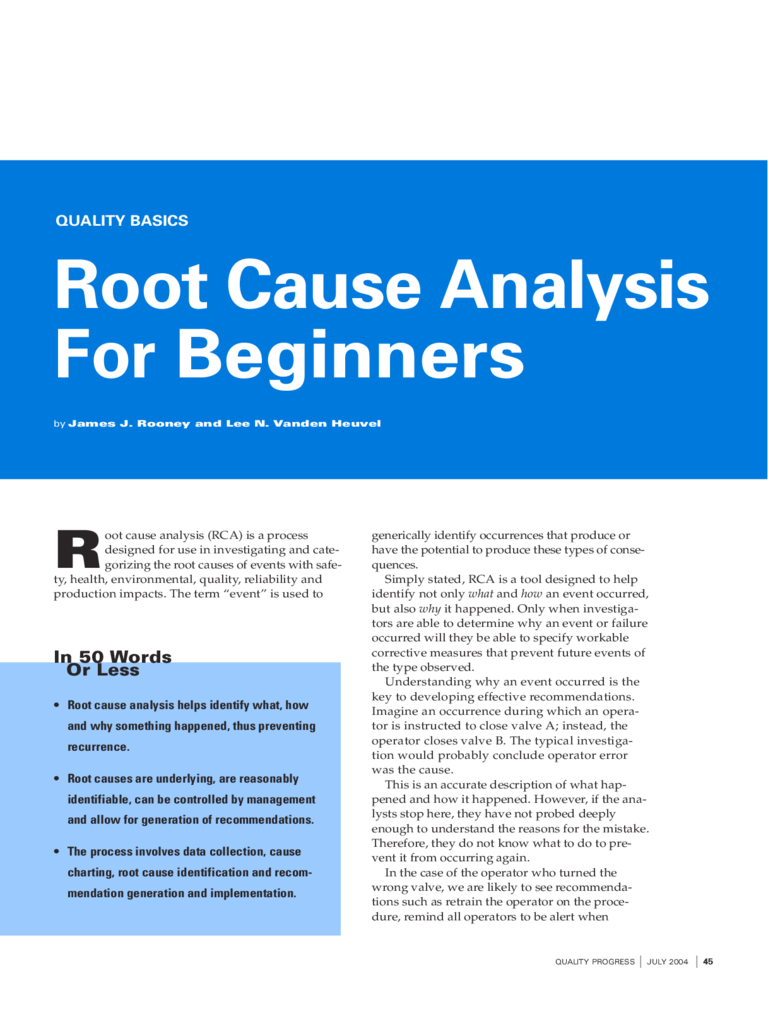
Causal Factor Chart
FIGURE 1
Aluminum
melts,
forming
hole in pan
Electric
burner
shorts out
Grease ignites
when it
contacts
burner
Fire starts
on the
stove
Mary meets
with Jane
Arcing heats
bottom of
aluminum
pan
Mary leaves
the frying
chicken
unattended
Jane rings
the doorbell
Jane comes
to the door
Mary
begins
frying
chicken
Mary
uses an
aluminum
pan
CF
CF
Mary
Pan
Jane
Jane, Mary
Mary
Burner
Pan
Pan
Conclusion
Mary
Mary
10 minutes
Fire
generates
smoke
Assumed
Mary runs
into the
kitchen
Mary
Smoke
detector
alarms
Jane, Mary
About 5:10 pm
Fire extinguisher
is not
charged
Mary
Fire extinguisher
does not
operate when
Mary tries to use it
Mary
Mary pulls
the plug
on the fire
extinguisher
Mary
Mary sees
the fire
on the stove
Mary
Mary tries
to use
the fire
extinguisher
Mary
CF
How
much oil is
used? How
much chicken?
Chicken,
pan, oil
What
exactly
did she see?
Mary
Had it
been
previously used?
Inspection tag
Had it
not been
originally charged?
Fire
extinguisher
Had it
leaked?
Fire extinguisher,
floor
Does Mary
know how
to use a fire
extinguisher?
Mary
Is "plug"
the same
as pin?
Mary
Part one
CF = Causal factor
5:00 pm
Figure 1 continued on next page
48
I
JULY 2004
I
www.asq.org
3. Root cause identification.
4. Recommendation generation and implementa-
tion.
Step one—data collection. The first step in the
analysis is to gather data. Without complete infor-
mation and an understanding of the event, the
causal factors and root causes associated with the
event cannot be identified. The majority of time
spent analyzing an event is spent in gathering
data.
Step two—Causal factor charting. Causal factor
charting provides a structure for investigators to orga-
nize and analyze the information gathered during
the investigation and identify gaps and deficiencies
in knowledge as the investigation progresses. The
causal factor chart is simply a sequence diagram
with logic tests that describes the events leading up
to an occurrence, plus the conditions surrounding
these events (see Figure 1, p. 47).
Preparation of the causal factor chart should
begin as soon as investigators start to collect infor-
mation about the occurrence. They begin with a
skeleton chart that is modified as more relevant
facts are uncovered. The causal factor chart should
drive the data collection process by identifying
data needs.
Data collection continues until the investigators
are satisfied with the thoroughness of the chart
(and hence are satisfied with the thoroughness of
the investigation). When the entire occurrence has
been charted out, the investigators are in a good
position to identify the major contributors to the
incident, called causal factors. Causal factors are
those contributors (human errors and component
failures) that, if eliminated, would have either pre-
vented the occurrence or reduced its severity.
In many traditional analyses, the most visible
causal factor is given all the attention. Rarely, how-
ever, is there just one causal factor; events are usu-
ally the result of a combination of contributors.
When only one obvious causal factor is addressed,
the list of recommendations will likely not be com-
plete. Consequently, the occurrence may repeat
itself because the organization did not learn all that
it could from the event.
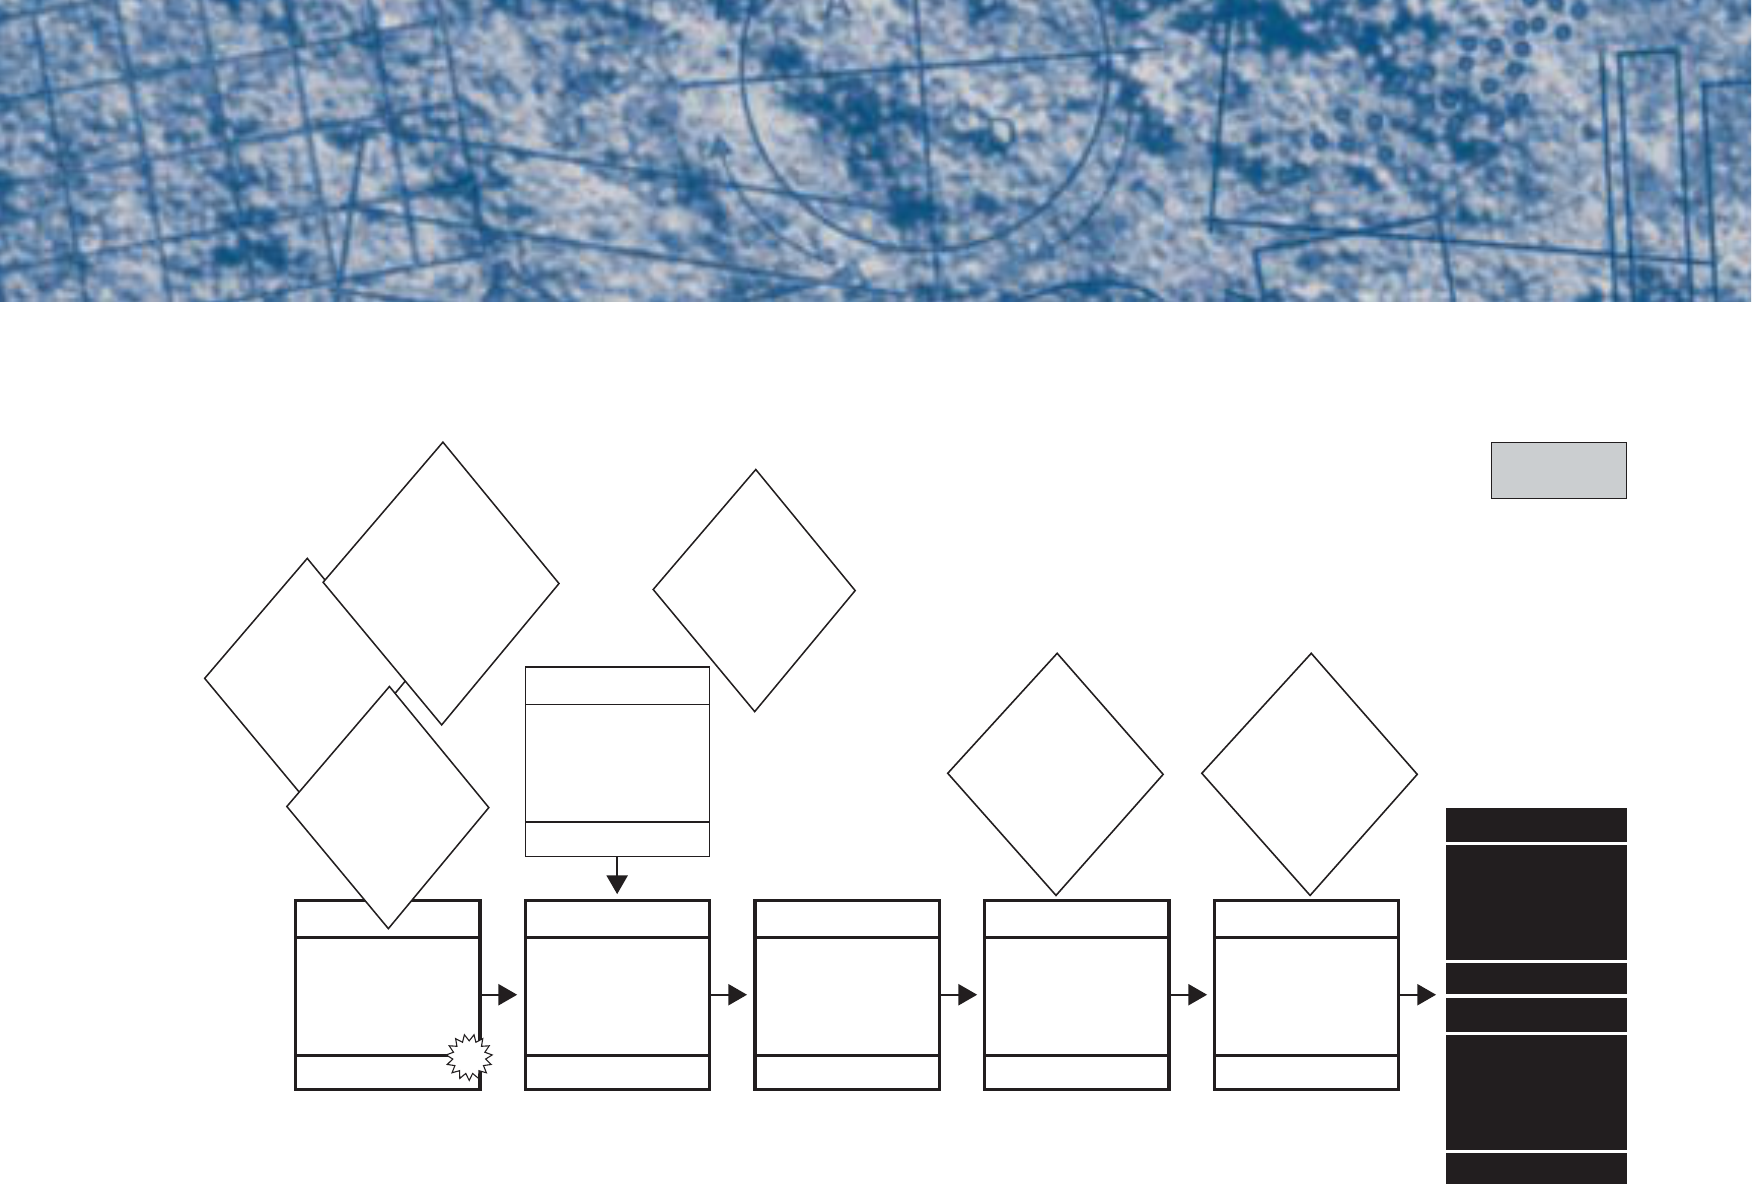
Step three—root cause identification. After all
the causal factors have been identified, the investi-
gators begin root cause identification. This step
QUALITY BASICS
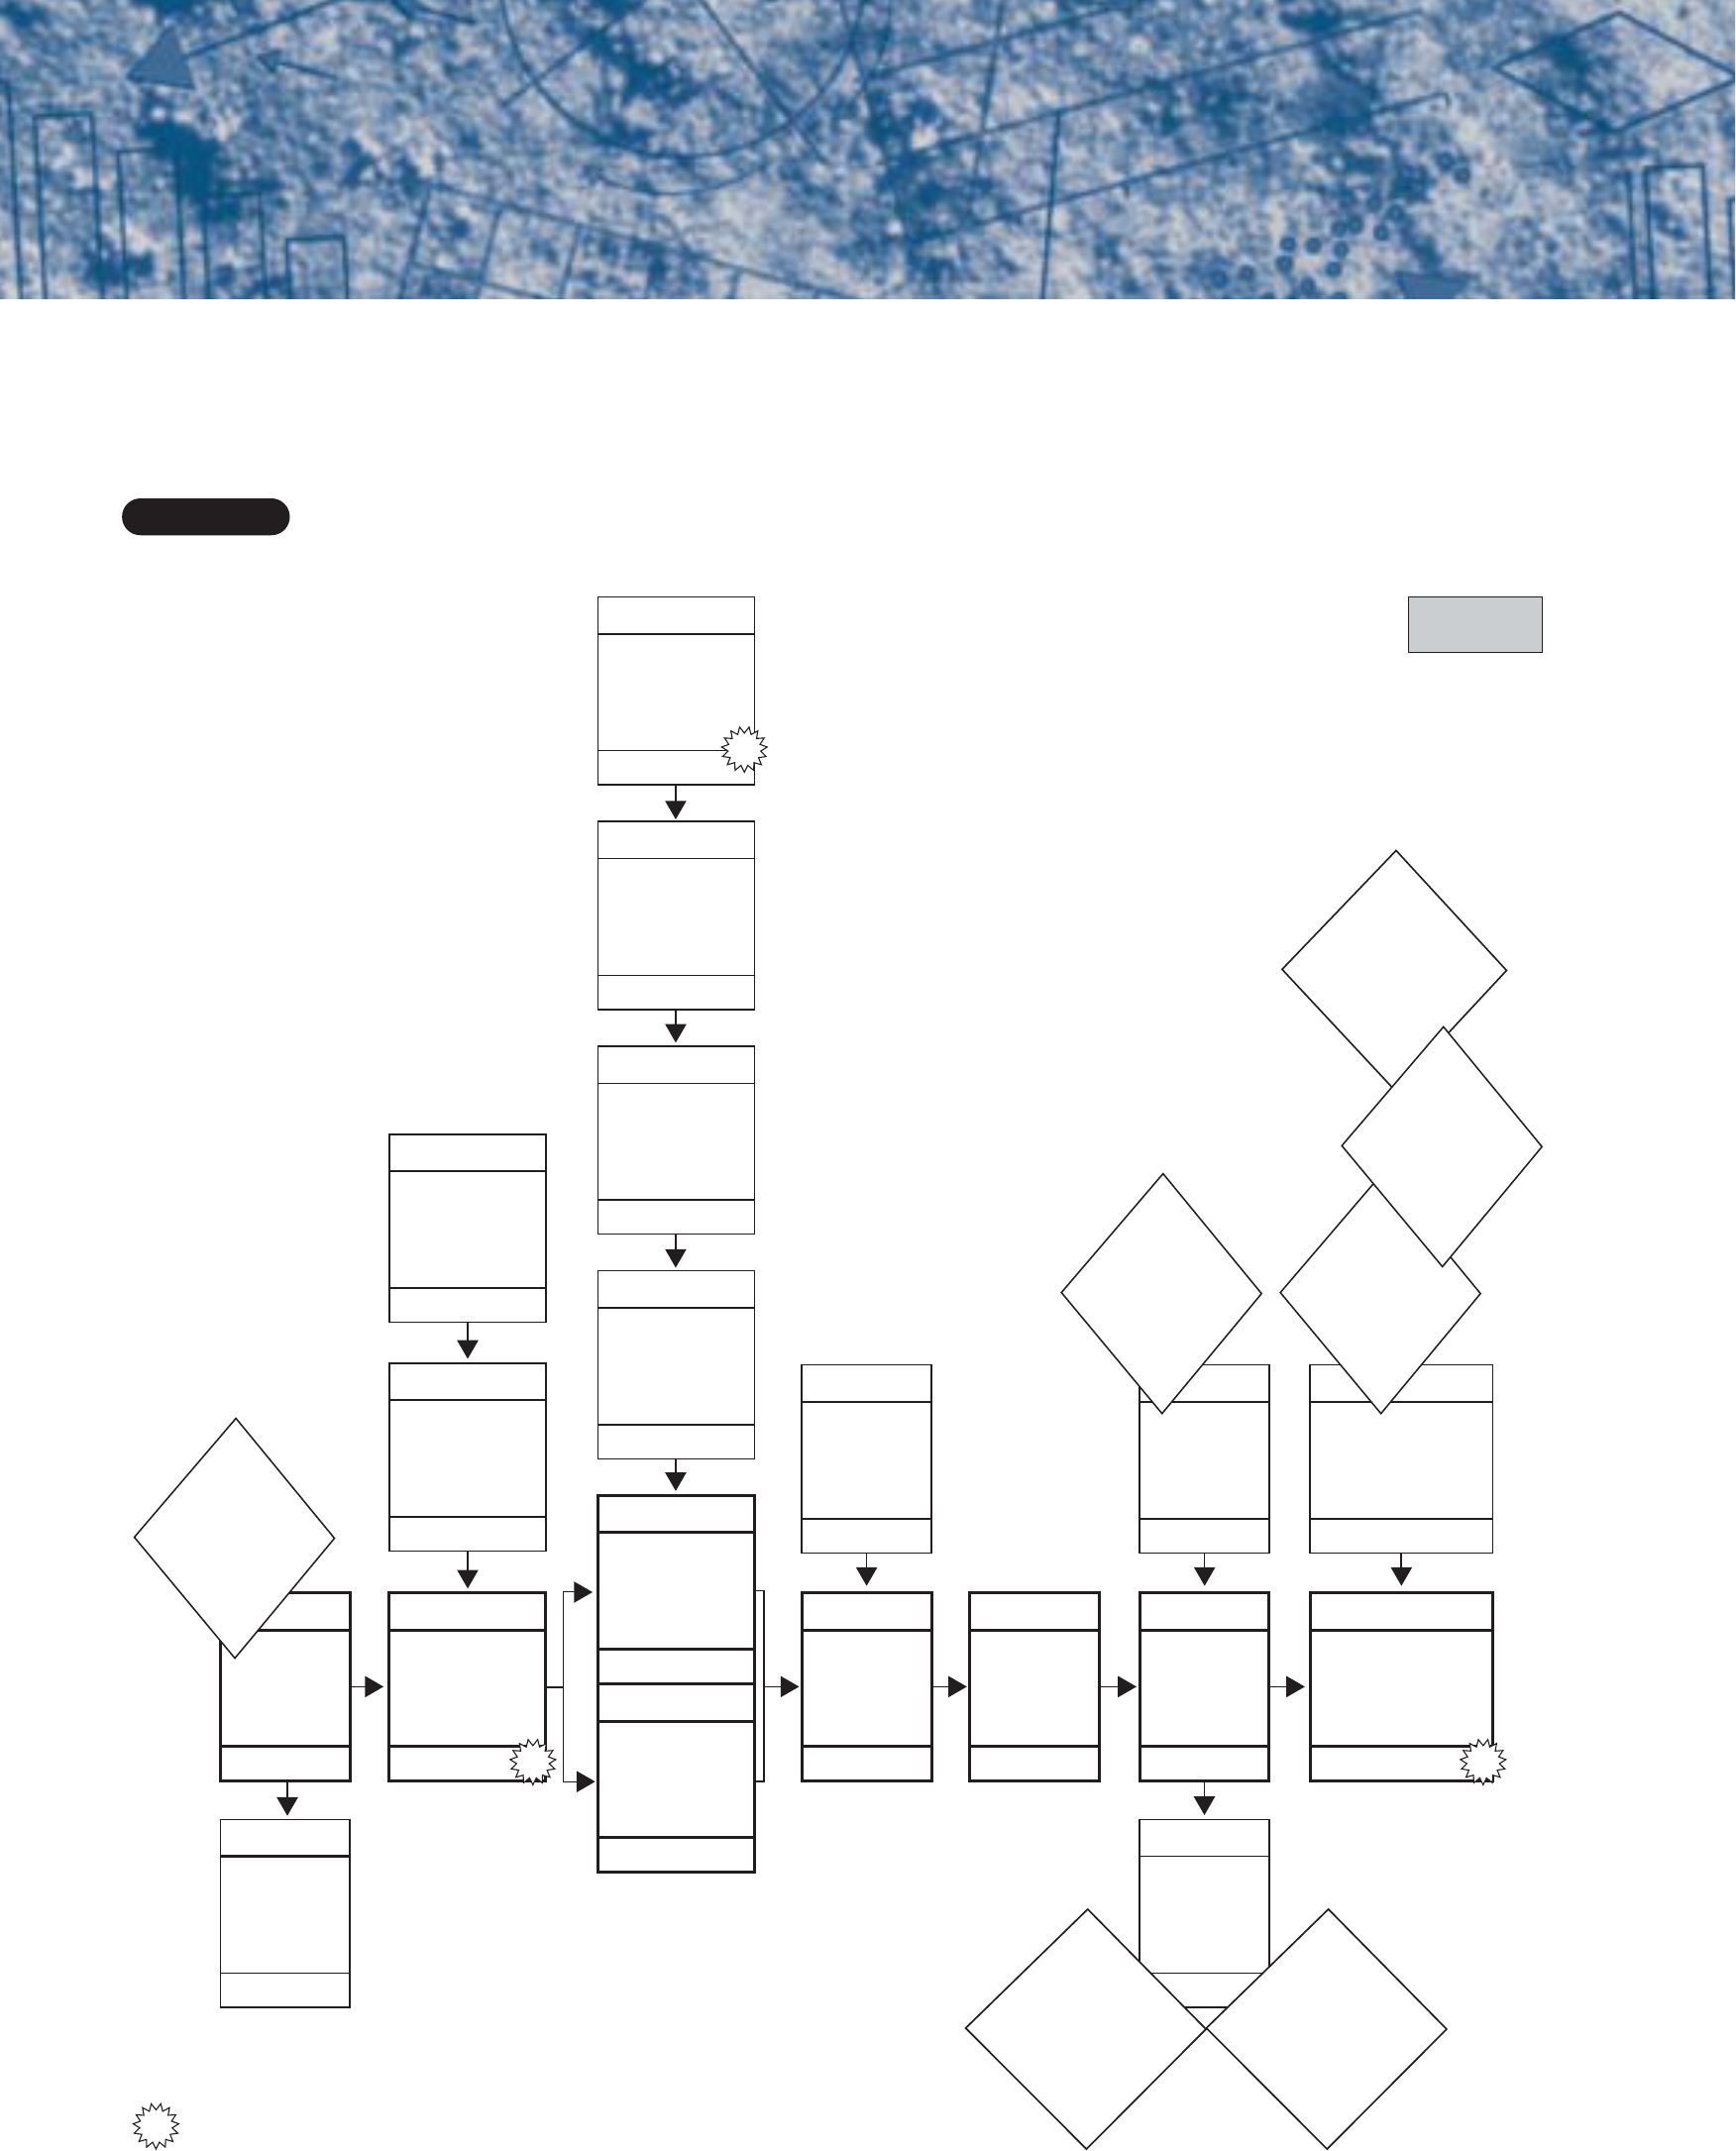
Part two
Fire spreads
throughout
the kitchen
Kitchen, Mary
Mary throws
water on
the fire
Mary
Mary calls the
fire department
Mary, FD
Fire department
arrives
Observation
Fire department
puts out fire
FD, observation
Kitchen
destroyed
by fire
Other losses
from smoke and
water damage?
Time?Time?Time?
CF
Fire was a
grease fire
Mary, pan
Did she do
anything else?
Mary
Was Mary
trying to do this?
Mary
Did she know
this was wrong?
Lack of practice
fighting fires?
Mary
What is
Jane doing during
this time?
Mary, Jane
How long
did it take for the
FD to arrive?
FD
dispatcher
Did the FD
use the correct
techniques?
FD

QUALITY PROGRESS
I
JULY 2004
I
49
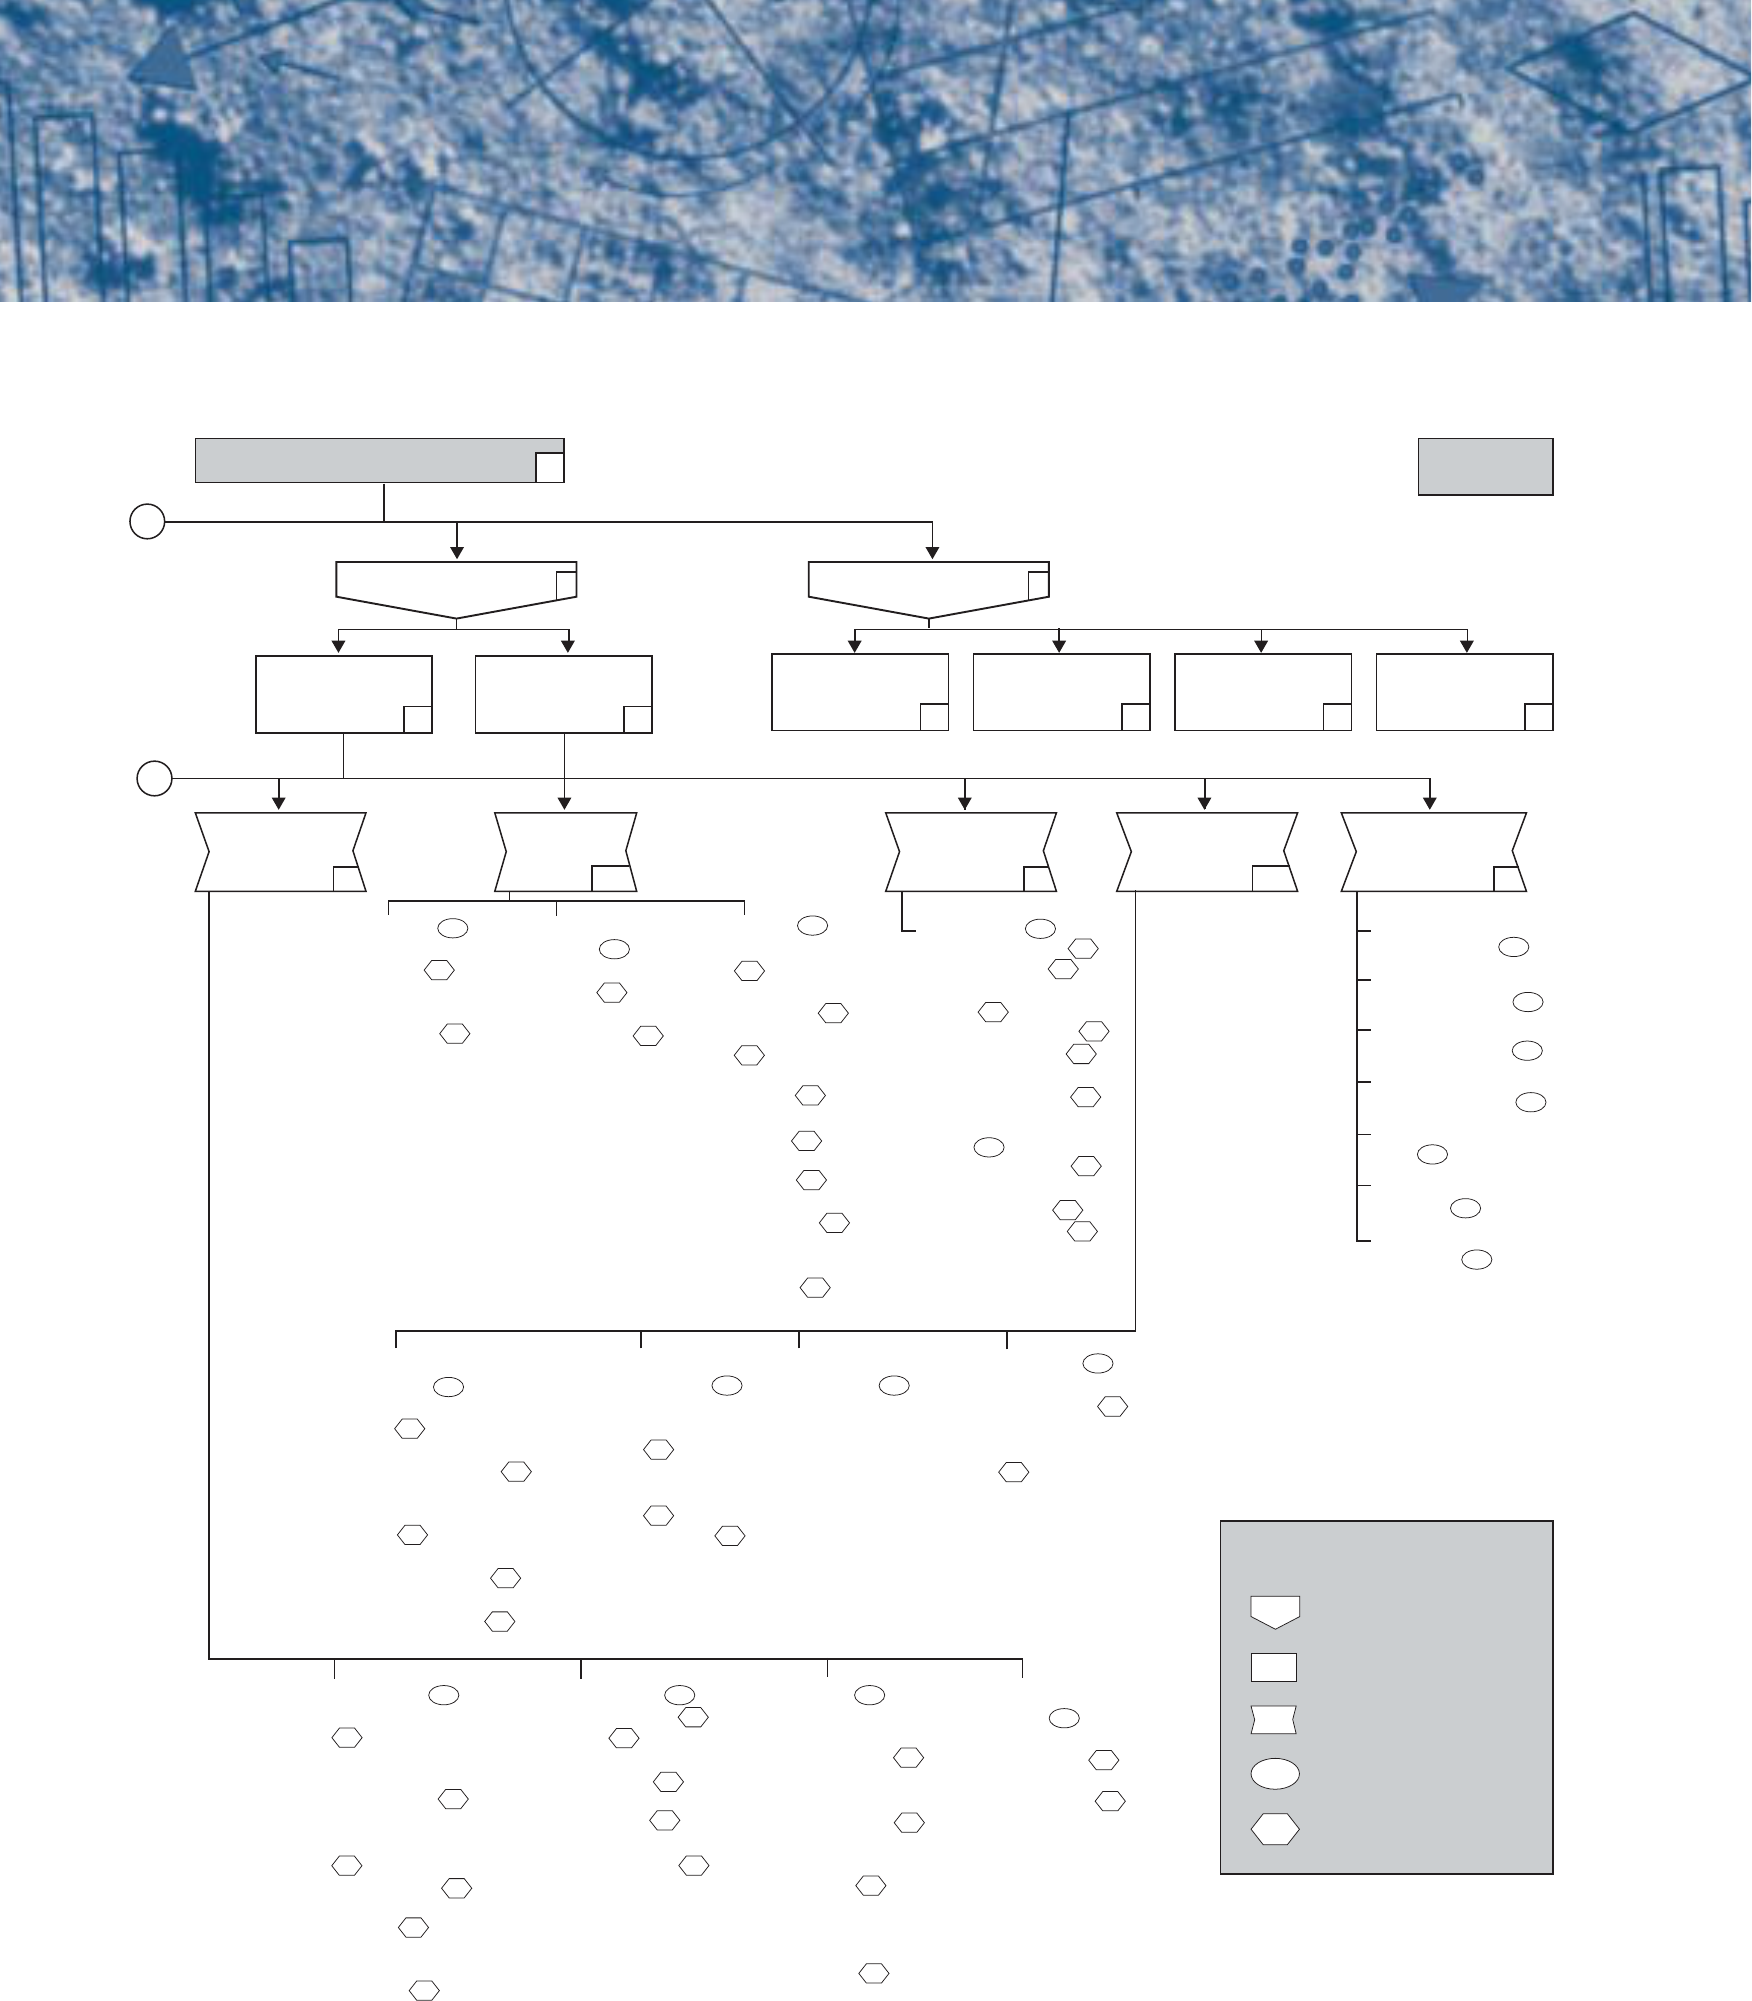
involves the use of a decision diagram called the
Root Cause Map (see Figure 2, p. 50) to identify the
underlying reason or reasons for each causal factor.
The map structures the reasoning process of the
investigators by helping them answer questions
about why particular causal factors exist or
occurred. The identification of root causes helps
the investigator determine the reasons the event
occurred so the problems surrounding the occur-
rence can be addressed.
Step four—recommendation generation and
implementation. The next step is the generation of
recommendations. Following identification of the
root causes for a particular causal factor, achievable
recommendations for preventing its recurrence are
then generated.
The root cause analyst is often not responsible
for the implementation of recommendations gener-
ated by the analysis. However, if the recommenda-
tions are not implemented, the effort expended in
performing the analysis is wasted. In addition, the
events that triggered the analysis should be expect-
ed to recur. Organizations need to ensure that rec-
ommendations are tracked to completion.
Presentation of Results
Root cause summary tables (see Table 1, p. 52)
can organize the information compiled during data
analysis, root cause identification and recommen-
dation generation. Each column represents a major
aspect of the RCA process.
•In the first column, a general description of the
causal factor is presented along with sufficient
background information for the reader to be
able to understand the need to address this
causal factor.
• The second column shows the Path or Paths
through the Root Cause Map associated with
the causal factor.
• The third column presents recommendations
to address each of the root causes identified.
Use of this three-column format aids the investi-
gator in ensuring root causes and recommenda-
tions are developed for each causal factor.
The end result of an RCA investigation is gener-
ally an investigation report. The format of the
report is usually well defined by the administrative
documents governing the particular reporting sys-
tem, but the completed causal factor chart and
causal factor summary tables provide most of the
information required by most reporting systems.
Example Problem
The following example is nontechnical, allowing
the reader to focus on the analysis process and not
the technical aspects of the situation. The following
narrative is the account of the event according to
Mary:
It was 5 p.m. I was frying chicken. My friend
Jane stopped by on her way home from the doc-
tor, and she was very upset. I invited her into
the living room so we could talk. After about 10
minutes, the smoke detector near the kitchen
came on. I ran into the kitchen and found a fire
on the stove. I reached for the fire extinguisher
and pulled the plug. Nothing happened. The
fire extinguisher was not charged. In despera-
tion, I threw water on the fire. The fire spread
throughout the kitchen. I called the fire depart-
ment, but the kitchen was destroyed. The fire
department arrived in time to save the rest of
the house.
Data gathering began as soon as possible after
the event to prevent loss or alteration of the data.
The RCA team toured the area as soon as the fire
department declared it safe. Because data from
people are the most fragile, Mary, Jane and the fire-
fighters were interviewed immediately after the
fire. Photographs were taken to record physical
and position data.
The analysts then developed the causal factor
chart (see Figure 1, p. 47) to clearly define the
sequence of events that led to the fire. The causal
factor chart begins with the event; Mary begins fry-
ing chicken at 5 p.m. As the chart develops from
In many traditional analyses,
the most visible causal factor
is given all the attention.
50
I
JULY 2004
I
www.asq.org
QUALITY BASICS
Root Cause Map
FIGURE 2
Section one
1
2
Start here with each causal factor.
1
6
Equipment
reliability program
problem
7
Installation/
fabrication
8
Equipment
misuse
2
Equipment difficulty
Corrective maintenance
LTA
• Troubleshooting/corrective
action LTA
• Repair implementation
LTA
Preventive maintenance
LTA
• Frequency LTA
• Scope LTA
• Activity implementation
LTA
Predictive maintenance
LTA
• Detection LTA
• Monitoring LTA
• Troubleshooting/
corrective action LTA
• Activity implementation
LTA
29
32
36
30
31
33
34
35
37
38
39
40
Proactive maintenance
LTA
• Event specification
LTA
• Monitoring LTA
• Scope LTA
• Activity implementation
LTA
Failure finding maintenance
LTA
• Frequency LTA
• Scope LTA
• Troubleshooting/
corrective action LTA
• Repair implementation
Routine equipment
rounds LTA
• Frequency LTA
• Scope LTA
• Activity implementation
LTA
41
42
43
44
45
47
48
49
50
52
53
54
46
51
Equipment reliability
program implementation
LTA
28
Procedures
111
No program
Program LTA
• Analysis/design
procedure LTA
• Inappropriate type
of maintenance
assigned
• Risk acceptance
criteria LTA
• Allocation of
resources LTA
22
23
24
25
26
27
Equipment reliability
program design
less than adequate (LTA)
21
16
Design input
LTA
Design output
LTA
17
Design input/
output
15
Equipment
design records
LTA
Equipment
operating/
maintenance
history LTA
19
20
Equipment
records
18
Administrative/
management
systems
55
Note: Node numbers correspond to matching page in Appendix A of the
Root Cause Analysis Handbook.
Customer
interface/
services
• Customer
requirements
not identified
• Customer needs
not addressed
• Implementation
LTA
106
108
109
110
Document and
configuration
control
• Change not
identified
• Verification of design/
field changes LTA
(no PSSR*)
• Documentation
content not kept
up to date
• Control of official
documents LTA
100
102
103
104
105
Procurement
control
• Purchasing
specifications LTA
• Control of changes
to procurement
specifications LTA
• Material acceptance
requirements LTA
• Material inspections
LTA
• Contractor selection
LTA
93
95
96
97
98
99
Product/material
control
• Handling LTA
• Storage LTA
• Packaging/
shipping LTA
• Unauthorized material
substitution
• Product acceptance
criteria LTA
• Product inspections
LTA
85
87
88
89
90
91
92
Safety/hazard/
risk review
• Review LTA or
not performed
• Recommendations not
yet implemented
• Risk acceptance
criteria LTA
• Review procedure
LTA
72
74
75
76
77
Standards,
policies or
administrative
controls (SPACs)
LTA
• No SPACs
• Not strict
enough
• Confusing,
contradictory or
incomplete
• Technical error
• Responsibility
for item/activity
not adequately
defined
• Planning, scheduling
or tracking of work
activities LTA
• Rewards/incentives
LTA
• Employee screening/
hiring LTA
57
59
60
61
62
63
64
65
66
SPACs not used
• Communication of
SPACs LTA
• Recently changed
• Enforcement LTA
67
69
70
71
Problem
identification
control
• Problem reporting
LTA
• Problem analysis
LTA
• Audits LTA
• Corrective action
LTA
• Corrective actions not
yet implemented
78
80
81
82
83
84
Not used
• Not available or
inconvenient to
obtain
• Procedure difficult
to use
• Use not required
but should be
• No procedure for
task
112
113
114
115
116
Misleading/confusing
• Format confusing or
LTA
• More than one action
per step
• No checkoff space
provided but should be
• Inadequate checklist
• Graphics LTA
• Ambiguous or confusing
instructions/
requirements
• Data/computations
wrong/incomplete
• Insufficient or excessive
references
• Identification of revised
steps LTA
• Level of detail LTA
• Difficult to identify
118
117
120
121
122
123
124
125
126
127
128
129
Wrong/incomplete
• Typographical error
• Sequence wrong
• Facts wrong/
requirements not
correct
• Wrong revision or
expired procedure
revision used
• Inconsistency
between
requirements
• Incomplete/situation
not covered
• Overlap or gaps
between
procedures
130
131
132
133
134
135
136
137
5
Equipment
design problem
Figure 2 continued on next page
QUALITY PROGRESS
I
JULY 2004
I
51
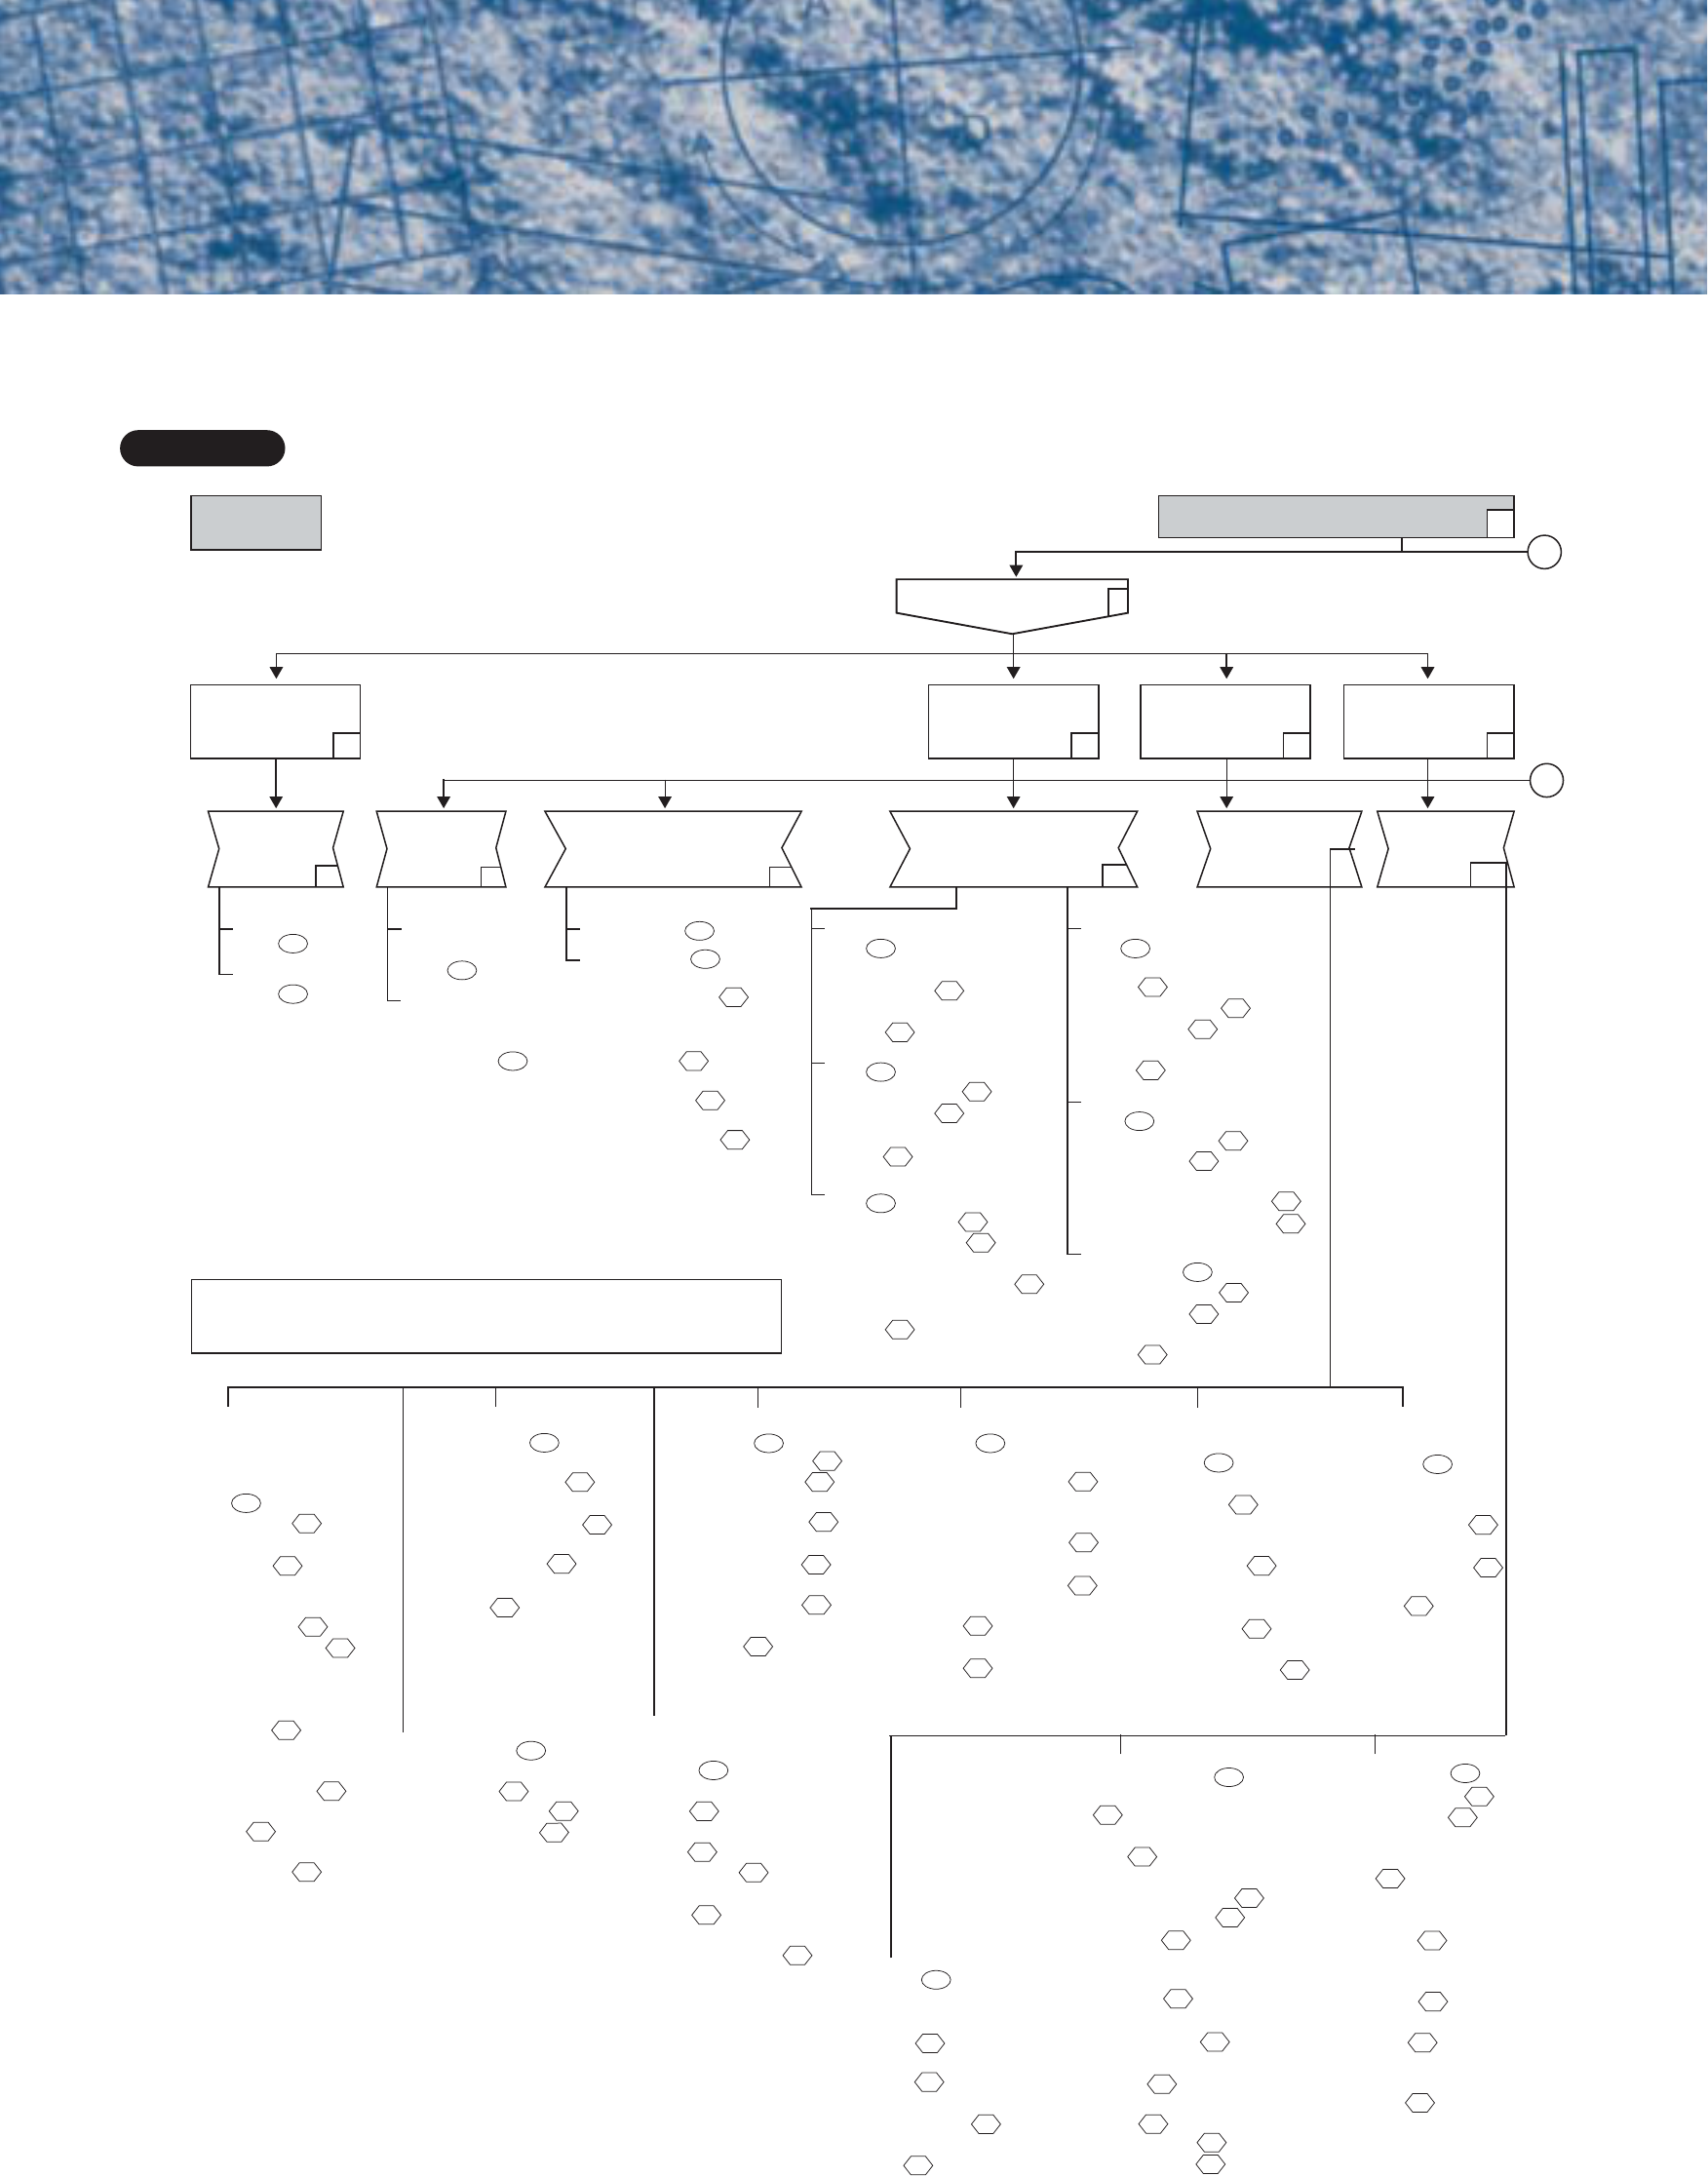
Section Two
Start here with each causal factor.
1
4
Other difficulty
1
3
Personal difficulty
9
Company
employee
10
Contract
employee
11
Natural
phenomena
12
Sabotage/
horseplay
13
External
events
14
Other
Training
163
Human factors
engineering
138
Communications
192
No training
• Decision not
to train
• Training
requirements not
identified
164
165
166
Training records
system LTA
• Training records
incorrect
• Training records
not up to date
167
168
169
Training LTA
• Job/task analysis
LTA
• Program design/
objectives LTA
• Lesson content
LTA
• On-the-job
training LTA
• Qualification
testing LTA
• Continuing
training LTA
• Training
resources LTA
• Abnormal events/
emergency
training LTA
170
171
172
174
175
176
177
178
179
Immediate
supervision
180
Preparation
• No preparation
• Job plan LTA
• Instructions to workers
LTA
• Walkthrough LTA
• Scheduling LTA
• Worker selection/
assignment LTA
Supervision during
work
• Supervision LTA
• Improper performance
not corrected
• Teamwork LTA
181
182
188
183
184
185
186
187
189
190
191
Personal
performance
208
Problem
detection LTA
*Sensory/perceptual
capabilities LTA
*Reasoning
capabilities LTA
*Motor/physical
capabilities LTA
*Attitude/attention
LTA
*Rest/sleep LTA
(fatigue)
*Personal/medication
problems
209
210
211
212
213
214
215
No communication or
not timely
• Method unavailable or
LTA
• Communication between
work groups LTA
• Communication between
shifts and management
LTA
• Communication with
contractors LTA
• Communication with
customers LTA
194
195
196
197
198
199
Misunderstood
communication
• Standard
terminology not
used
• Verification/
repeat back not
used
• Long message
200
201
202
203
Wrong
instructions
204
Job turnover LTA
• Communication
within shifts LTA
• Communication
between shifts
LTA
205
206
207
Workplace layout
• Controls/displays
LTA
• Control/display
integration/
arrangement LTA
• Location of
controls/displays
LTA
• Conflicting layouts
• Equipment
location LTA
• Labeling of
equipment or
locations LTA
140
141
143
144
145
146
147
Work environment
• Housekeeping LTA
• Tools LTA
• Protective clothing/
equipment LTA
• Ambient
conditions LTA
• Other environmental
stresses excessive
148
149
150
151
152
154
Workload
• Excessive control
action
requirements
• Unrealistic
monitoring
requirements
• Knowledge based
decision
required
• Excessive
calculation or
data manipulation
required
155
156
157
158
159
Intolerant
system
• Errors not
detectable
• Errors not
correctable
160
162
161
2
© 1995, 1997, 1999, 2000 and 2001, ABSG Consulting Inc.
*Note: These nodes are for descriptive
purposes only.
Shape Description
Primary difficulty source
Problem category
Root cause category
Near root cause
Root cause
*PSSR = Project scope summary report

52
I
JULY 2004
I
www.asq.org
QUALITY BASICS
Root Cause Summary Table
TABLE 1
Event description: Kitchen is destroyed by fire and damaged by smoke and water. Event #: 2003-1
Description:
Mary leaves the frying chicken unattended.
• Personnel difficulty.
• Administrative/management systems.
• Standards, policies or administrative
controls (SPACs) less than adequate (LTA).
• No SPACs.
• Implement a policy that hot oil is never left
unattended on the stove.
• Determine whether policies should be
developed for other types of hazards in the
facility to ensure they are not left unattended.
• Modify the risk assessment process or
procedure development process to address
requirements for personnel attendance
during process operations.
Paths Through Root Cause Map RecommendationsCausal factor # 1
Description:
Electric burner element fails (shorts out).
• Equipment difficulty.
• Equipment reliability program problem.
• Equipment reliability program design LTA.
• No program.
• Replace all burners on stove.
• Develop a preventive maintenance strategy
to periodically replace the burner elements.
• Consider alternative methods for preparing
chicken that may involve fewer hazards,
such as baking the chicken or purchasing
the finished product from a supplier.
Description:
Fire extinguisher does not operate when
Mary tries to use it.
• Equipment difficulty.
• Equipment reliability program problem.
• Equipment proactive maintenance LTA.
• Activity implementation LTA.
• Equipment difficulty.
• Equipment reliability program problem.
• Administrative/management systems.
• Problem identification and control LTA.
• Refill the fire extinguisher.
• Inspect other fire extinguishers in the
facility to ensure they are full.
• Have incident reports describing the use of
fire protection equipment routed to
maintenance to trigger refilling of the fire
extinguishers.
• Add this fire extinguisher to the audit list.
• Verify that all fire extinguishers are on the
quarterly fire extinguisher audit list.
• Have all maintenance work requests that
involve fire protection equipment routed to
the safety engineer so the quarterly
checklists can be modified as required.
Description:
Mary throws water on fire.
• Personnel difficulty.
• Company employee.
• Training.
• Training LTA.
• Abnormal events/emergency training LTA.
• Provide practical (hands-on) training
on the use of fire extinguishers. Classroom
training may be insufficient to adequately
learn this skill.
• Review other skill based activities to
ensure appropriate level of hands-on training
is provided.
• Review the training development process
to ensure adequate guidance is provided for
determining the proper training setting (for
example,classroom, lab, simulator, on the job
training, computer based training).
Paths Through Root Cause Map is a trademark of ABSG Consulting.
Paths Through Root Cause Map RecommendationsCausal factor # 2
Paths Through Root Cause Map RecommendationsCausal factor # 3
Paths Through Root Cause Map RecommendationsCausal factor # 4

left to right, the sequences begin to unfold. The loss
events—kitchen destroyed by fire and other losses
from smoke and water damage—are the shaded
rectangles in the causal factor chart.
Although we read the chart from left to right, it
is developed from right to left (backwards).
Development always starts at the end because that
is always a known fact. Logic and time tests are
used to build the chart back to the beginning of
the event. Numerous questions are usually gener-
ated that identify additional necessary data.
After the causal factor chart was complete (addi-
tional data were gathered to answer the questions
shown in Figure 1), the analysts identified the fac-
tors that influenced the course of events. There are
four causal factors for this event (see Table 1).
Elimination of these causal factors would have
either prevented the occurrence or reduced its sever-
ity. Note the recommendations in Table 1 are written
as if Mary’s house were an industrial facility.
Notice that causal factor two may be unexpect-
ed. It wasn’t overheating of the oil or splattering of
the oil that ignited the fire. If the wrong causal fac-
tor is identified, the wrong corrective actions will
be developed.
The application of the technique identified that
the electric burner element failed by shorting out.
The short melted Mary’s aluminum pan, releasing
the oil onto the hot burner, starting the fire.
The analyst must be willing to probe the data
first to determine what happened during the occur-
rence, second to describe how it happened, and
third to understand why.
BIBLIOGRAPHY
Accident/Incident Investigation Manual, second edition,
DOE/SSDC 76-45/27, Department of Energy.
Events and Causal Factors Charting, DOE/SSDC 76-45/14,
Department of Energy, 1985.
Ferry, Ted S., Modern Accident Investigation and Analysis, sec-
ond edition, John Wiley and Sons, 1988.
Guidelines for Investigating Chemical Process Incidents,
American Institute of Chemical Engineers, Center for
Chemical Process Safety, 1992.
Occupational Safety and Health Administration Accident
Investigation Course, Office of Training and Education, 1993.
Root Cause Analysis Handbook, WSRC-IM-91-3, Department of
Energy, 1991 (and earlier versions).
Root Cause Analysis Handbook: A Guide to Effective
Investigation, ABSG Consulting Inc., 1999.
User’s Guide for Reactor Incident Root Cause Coding Tree, revi-
sion five, DPST-87-209, E.I. duPont de Nemours, Savan-
nah River Laboratory, 1986.
JAMES J. ROONEY
is a senior risk and reliability engineer
with ABSG Consulting Inc.’s Risk Consulting Division in
Knoxville, TN. He earned a master’s degree in nuclear engi-
neering from the University of Tennessee. Rooney is a Fellow
of ASQ and an ASQ certified quality auditor, quality audi-
tor-hazard analysis and critical control points, quality engi-
neer, quality improvement associate, quality manager and
reliability engineer.
LEE N. VANDEN HEUVEL is a senior risk and reliability
engineer with ABSG Consulting Inc.’s Risk Consulting
Division in Knoxville, TN. He earned a master’s degree in
nuclear engineering from the University of Wisconsin.
Vanden Heuvel co-authored the Root Cause Analysis
Handbook: A Guide to Effective Incident Investiga-
tion, co-developed the RootCause Leader software and was
a co-author of the Center for Chemical Process Safety’s
Guidelines for Investigating Chemical Process
Incidents. He develops and teaches courses on the subject.
QUALITY PROGRESS
I
JULY 2004
I
53
comment
Please
If you would like to comment on this article,
please post your remarks on the
Quality Progress
Discussion Board at www.asq.org, or e-mail them