Fillable Printable Cost Benefit Analysis Template, Version 2.02
Fillable Printable Cost Benefit Analysis Template, Version 2.02
Cost Benefit Analysis Template, Version 2.02

Engineering Solutions On-Line presents the
Cost Benefit Analysis Template
(with Amortization Calculator)
A product of Engineering Solutions On-Line,
a division of Armitage Consulting
Copyright 2009, Armitage Consulting, all rights reserved
Author: John Cesarone, Ph.D., P.E.
Date: May 2009
Version: 2.02
Contact Information:
e-mail:
web:
phone: 312.493.0839
fax: 504.285.0687
Note to users: feel free to use and freely copy this software template for your own use and that of
your organization or company. However, your individual license is not transferable to other organizations,
nor are you authorized to duplicated this template for sale or other gain other than internal use.
jcesarone999@gmail.com
http://EngineeringSolutions.homestead.com

Cost Benefit Analysis Template
Note to users: feel free to use and freely copy this software template for your own use and that of
your organization or company. However, your individual license is not transferable to other organizations,
nor are you authorized to duplicated this template for sale or other gain other than internal use.

Cost Benefit Analysis Template
General Instructions Page
This Cost/Benefit template will help you to create your own cost/benefit analysis of any project. As configured,
it provides Net Present Value of a project, Internal Rate of Return, and Payback Schedule. However, the paid version is easily
expanded and modified using simple Excel programming.
It is set up to operate on a year-by-year basis, but can easily be modified (paid version only) for month-by-month or any other basis if you prefer.
The chart is currently configured with 10 columns, to analyze budgets of up to 10 years long. To extend the paid version to longer projects,
merely highlight the last column, drag your selection to the right the required number of new columns, and hit Edit-Fill-Right.
For information on unlocking this file for modification, visit EngineeringSolutions.homestead.com or email jcesarone9[email protected].
To use this template, follow these steps:
STEP 1:
Go to the "Costs" page and enter your costs (see detailed instructions there)
STEP 2:
Go to the "Benefits" page and enter your benefits (see detailed instructions there)
STEP 3:
Go to the "Summary" page for CBA metrics of your project.
Charts of Costs and Benefits are also provided on the next three pages.
Bonus Step:
This latest version of the Cost Benefit Analysis template includes a Mortgage Amortization calculator on the final sheet.

This Cost/Benefit template will help you to create your own cost/benefit analysis of any project. As configured,
it provides Net Present Value of a project, Internal Rate of Return, and Payback Schedule. However, the paid version is easily
It is set up to operate on a year-by-year basis, but can easily be modified (paid version only) for month-by-month or any other basis if you prefer.
The chart is currently configured with 10 columns, to analyze budgets of up to 10 years long. To extend the paid version to longer projects,
merely highlight the last column, drag your selection to the right the required number of new columns, and hit Edit-Fill-Right.
For information on unlocking this file for modification, visit EngineeringSolutions.homestead.com or email jcesarone9[email protected].
Go to the "Benefits" page and enter your benefits (see detailed instructions there)
This latest version of the Cost Benefit Analysis template includes a Mortgage Amortization calculator on the final sheet.
Costs
Cost Benefit Analysis Template
Cost Data Entry Page
Fiscal Year
Program Element Element Manager 2009 2010 2011 2012 2013 2014 2015 2016 2017 2018
Element 1 Bill Smith $300,000 $250,000 $250,000
Element 2 Ed White $200,000 $150,000 $150,000
Element 3 Frank Burns $300,000 $250,000 $250,000
Element 4 Clay Forrester $400,000 $450,000 $500,000
Element 5 Jack Burton $150,000 $150,000 $150,000
Element 6 Mani Mahesh $400,000 $400,000 $400,000
Program Total Costs By Year $700,000 $650,000 $1,700,000 $1,000,000 $1,050,000 $0 $0 $0 $0 $0
Program Grand Total Cost $5,100,000
INSTRUCTIONS FOR THIS PAGE:
1. Enter the first year of your program in Cell C8. The next nine years will be filled in for you on this page and the following pages
(if you need more years, you can "insert" additional columns - paid version only)
2. Enter the names of your program elements in Column A, replacing "Element 1", etc.
(if you need more than six elements, you can "insert" additional rows - paid version only)
3. If you like, add extra information on each program element in Column B
(here, program element manager names have been added for illustration)
4. Enter the anticipated costs for each year for each program element in the appropriate cells. These should be
undiscounted costs, i.e., actual dollars, not equivalent dollars. Equivalence will be calculated automatically.
5. Total spending per year is shown on Row 15, and Grand Total cost for the program is on Row 17
Benefits
Cost Benefit Analysis Template
Benefit Data Entry Page
Fiscal Year
Benefit Sources 2009 2010 2011 2012 2013 2014 2015 2016 2017 2018
Cost Reduction $500,000 $525,000 $550,000 $600,000 $650,000 $700,000 $800,000 $1,000,000
Enhanced Revenues $250,000 $350,000 $500,000 $600,000 $750,000 $800,000 $900,000
Labor Reduction $100,000 $100,000 $100,000 $100,000 $100,000 $100,000 $100,000
Decreased Overhead $50,000 $50,000 $50,000 $50,000 $50,000 $50,000 $50,000 $50,000
Total Benefits Per Year $0 $0 $550,000 $925,000 $1,050,000 $1,250,000 $1,400,000 $1,600,000 $1,750,000 $2,050,000
Confidence Factor 100% 100% 100% 100% 100% 100% 100% 100% 100% 100%
Benefits Claimed for Analysis $0 $0 $550,000 $925,000 $1,050,000 $1,250,000 $1,400,000 $1,600,000 $1,750,000 $2,050,000
Program Grand Total Benefit $10,575,000
INSTRUCTIONS FOR THIS PAGE:
2. Enter the sources of benefits you expect in Column A, as shown
(if you need more than four categories of benefits, feel free to insert extra rows - paid version only)
3. If desired, enter a "Confidence Factor" on Row 14 for each year; this should be between 0 and 100%,
and enables you to perform analyses of varying levels of optimism or pessimism. If you do not wish
to use this feature, leave all entries at 100%
4. Total Benefits by year, adjusted for your level of confidence, is shown on Row 15, and Grand Total on Row 17
As with our costs, these are un-discounted so far (that is, not converted to equivalent-year dollars).
Summary
Cost Benefit Analysis Template
Results Calculation Page
Fiscal Year
2009 2010 2011 2012 2013 2014 2015 2016 2017 2018
Undiscounted Flows
Costs -$700,000 -$650,000 -$1,700,000 -$1,000,000 -$1,050,000 $0 $0 $0 $0 $0
Benefits $0 $0 $550,000 $925,000 $1,050,000 $1,250,000 $1,400,000 $1,600,000 $1,750,000 $2,050,000
Net Cash Flow -$700,000 -$650,000 -$1,150,000 -$75,000 $0 $1,250,000 $1,400,000 $1,600,000 $1,750,000 $2,050,000
Discount Factors
Discount Rate 7.0%
Base Year 2009
Year Index 0 1 2 3 4 5 6 7 8 9
Discount Factor 1.0000 0.9346 0.8734 0.8163 0.7629 0.7130 0.6663 0.6227 0.5820 0.5439
Discounted Flows
Costs -$700,000 -$607,477 -$1,484,846 -$816,298 -$801,040 $0 $0 $0 $0 $0
Benefits $0 $0 $480,391 $755,076 $801,040 $891,233 $932,879 $996,400 $1,018,516 $1,115,064
Net -$700,000 -$607,477 -$1,004,455 -$61,222 $0 $891,233 $932,879 $996,400 $1,018,516 $1,115,064
Cumulative -$700,000 -$1,307,477 -$2,311,931 -$2,373,154 -$2,373,154 -$1,481,921 -$549,042 $447,358 $1,465,874 $2,580,938
Net Present Value $2,580,938
Internal Rate of Return 21%
INSTRUCTIONS FOR THIS PAGE:
1. The years will be automatically entered on row 8 to exactly match those on the Costs page; do not enter anything here.
2. Enter your "discount rate" in cell B14; this is the cost of money that determines the time value of your costs and benefits
(for illustration, if you were working with an interest-free loan, this would be zero; a typical value is around 8%)
3. Enter the year you will kick off the project in cell B15; this will be used as the "now" in the CBA calculations on future values
(typically, "now" means the current year, which is the year of your initial investment, but it might be different if your plans are for the future)
INTERPRETATION OF RESULTS:
Row 17 shows the discount factor; this is how much less the cash flows are worth because they are in the future
Row 19 shows the discounted costs, and Row 20 shows the discounted benefits. "Discounted" means "in year-0 dollars."
Row 21 shows the discounted net value per year, and Row 21 shows the accumulated discounted net value per year
Row 22 shows the cumulative net value for all years so far (when this becomes positive, you have completed your "payback period")
Row 24 shows the "Net Present Value" of your program; this means that the entire project is economically
Row 25 shows the Internal Rate of Return; this means, the interest rate that would make your project exactly break even.
Another way to interpret this is, if you had put the money in a bank account at this interest rate, you would get
the exact same monetary benefits as you received from performing this program
CHARTS PROVIDED:
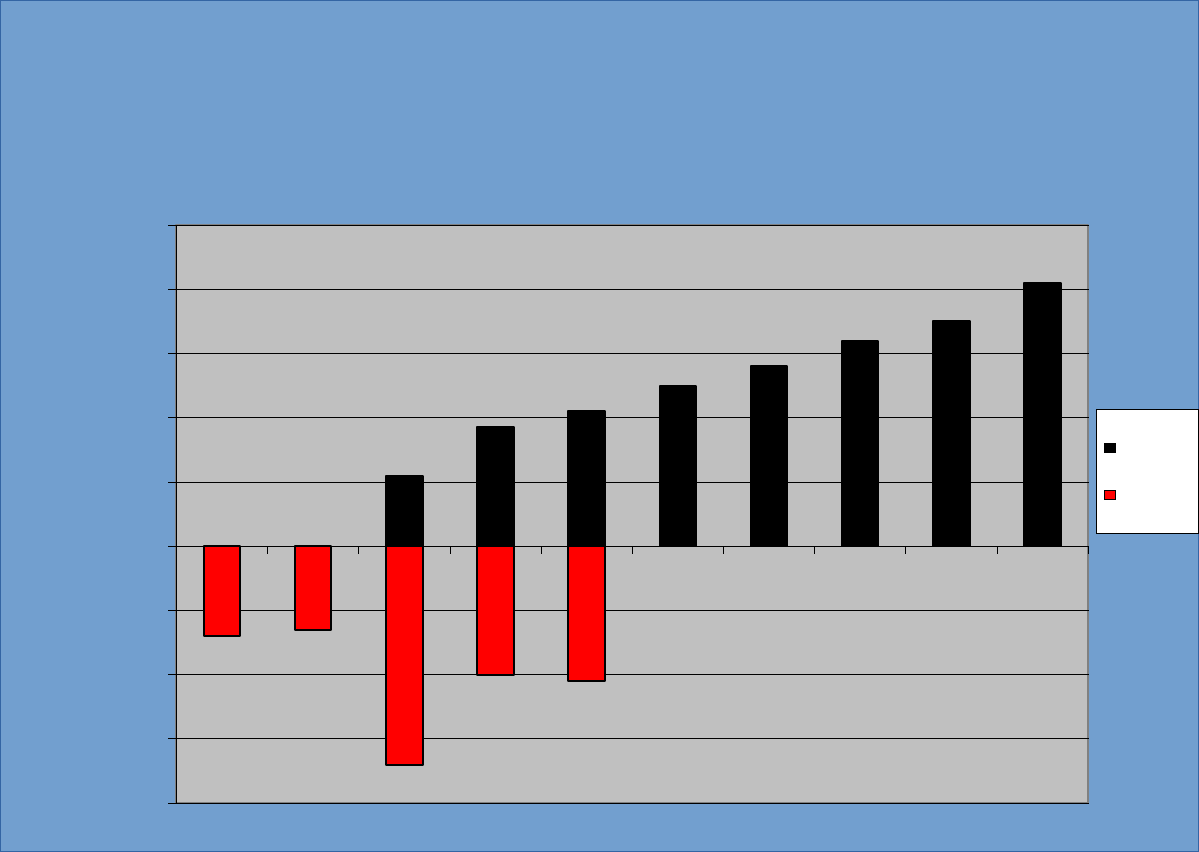
The first chart, Undiscounted Cash Flows, shows actual costs expended and benefits accrued, adjusted by
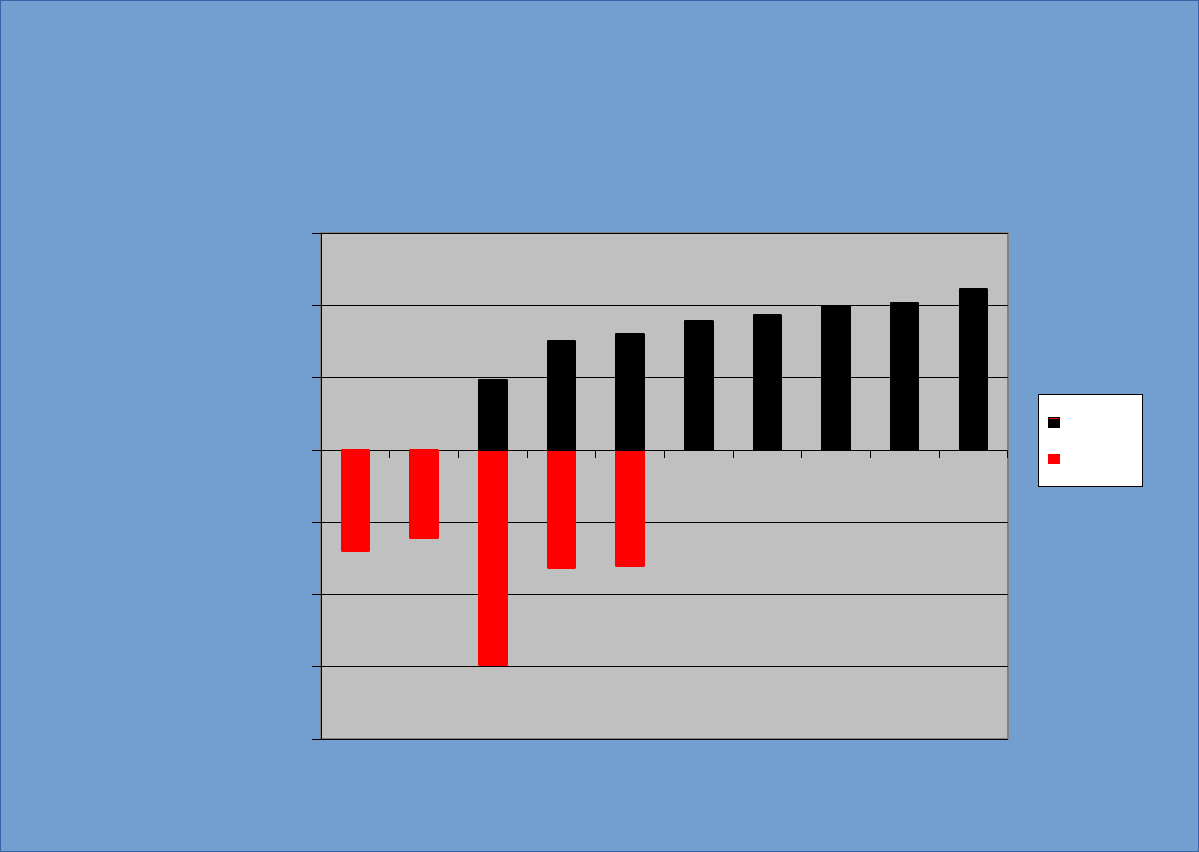
The second chart, Discounted Cash Flows, shows costs expended and benefits to be accrued, adjusted by
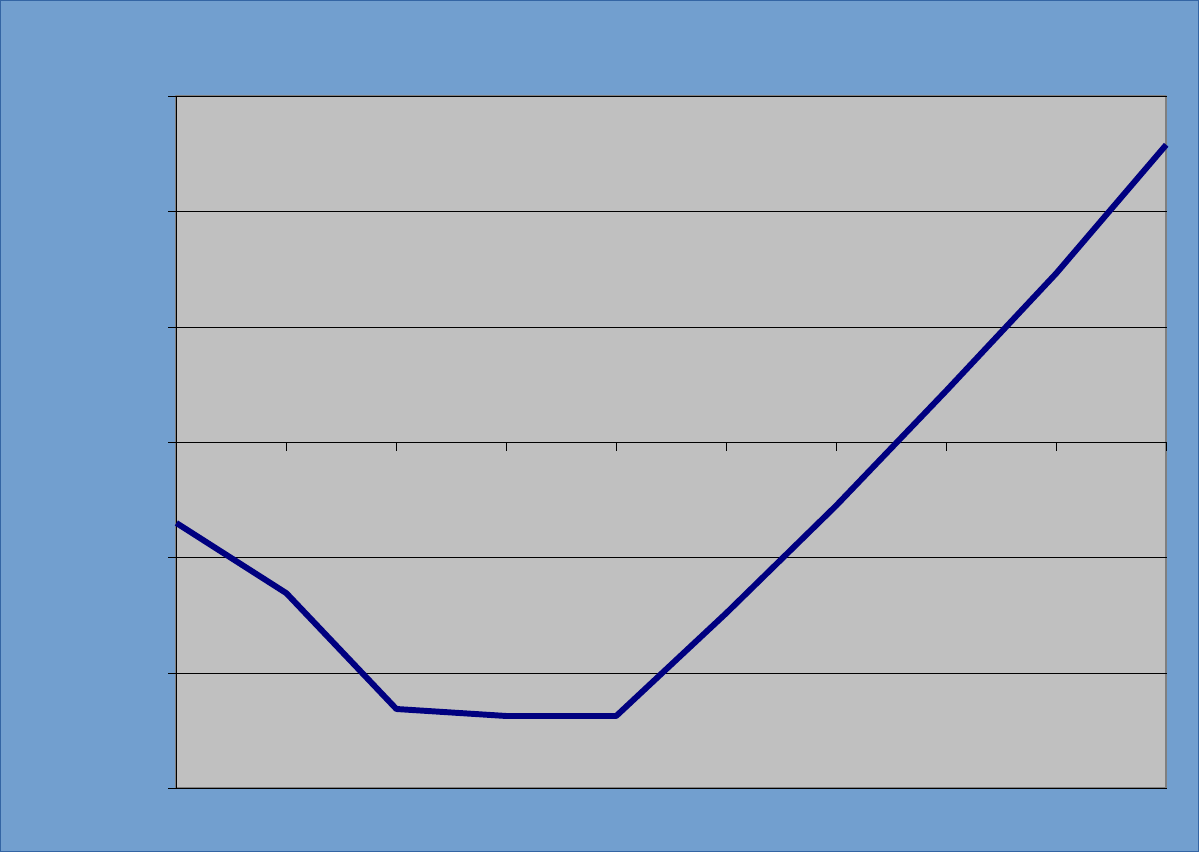
The third chart, Payback Schedule, shows benefits accrued minus costs expended, in base year dollars. When this
chart crosses above the zero line, the program has achieved profitability
Sufficient data exists in the above summary to create any other charts you desire; or contact
us at 312.266.4828 or at [email protected], or visit us at EngineeringSolutions.homestead.com
for futher assistance
equivalent to this much money in your hands right now, based on the discount rate you entered
confidence factor, in each years' current dollars
confidence factor, in base year dollars
2009 2010 2011 2012 2013 2014 2015 2016 2017 2018
-$2,000,000
-$1,500,000
-$1,000,000
-$500,000
$0
$500,000
$1,000,000
$1,500,000
$2,000,000
$2,500,000
Undiscounted Cash Flows
Benefits
Costs
Fiscal Year
Co sts a nd Be ne fits in Cu rre n t Ye a r Do lla rs
2009 2010 2011 2012 2013 2014 2015 2016 2017 2018
-$2,000,000
-$1,500,000
-$1,000,000
-$500,000
$0
$500,000
$1,000,000
$1,500,000
Discounted Cash Flow
Benefits
Costs
Fiscal Year
Costs a nd Be ne fits in Ba se Ye a r Dolla rs
2009 2010 2011 2012 2013 2014 2015 2016 2017 2018
-$3,000,000
-$2,000,000
-$1,000,000
$0
$1,000,000
$2,000,000
$3,000,000
Discounted Payback
Fiscal Year
Base Year Dollars

Cost Benefit Analysis Template
The Softer Stuff…..
When you write up your Cost/Benefit Analysis, the mathematics presented in the previous sheets are very handy, and can
indeed be difficult for your audience to disagree with. They are, therefore, a good argument to make in support of (or against) the project
under consideration. However, there are always non-mathematical issues that must be dealt with. While these are difficult to
incorporate into the rigorous equations, they certainly must be addressed. If you do not address them yourself, you can be
certain that one of your detractors or competitors will mention them; better to deal with them in your own way, first. In this sheet,
then, we will discuss some of the "softer stuff" or non-monetary issues that are required in a Cost/Benefit Analysis.
First and foremost, is there business out there for you to go after in the first place? You are presenting some sort of monetary benefit;
you had better be prepared to demonstrate that this business is really out there, waiting to come to you. If not, your analysis fails
from the get-go. You had better be prepared to show that you are offering something your competitors are NOT offering: better price,
higher quality, superior delivery schedule or convenience, etc. If there ARE no current suppliers, well then, how do you know that there are
any customers? In reality, this work may already have been done for you, by your Marketing department. See what they know before
you knock yourself out.
Also, consider the symbiotic effects of your proposed venture, both good and bad. Will you be cannibalizing your own business in other
areas? If your particular division makes a killing, but another division of your company is the one that gets killed, your board of directors
will NOT be impressed! On the other hand, symbiotic effects can be good; two products that go together, from the same supplier, can
boost market share for both of those products (don’t believe me? Just ask Microsoft).
Sometimes, you need to invest in a project just to stay in business at all. For instance, say you are setting up a recall center or warranty
support office. This is not intended to make money on its own, but it lets you remain in business in your core area. In that case, you don't
need to show a profit, you just need to get the job done for the minimum cost. In cases like this, your goal in a Cost/Benefit analysis is to
lose the least amount of money while meeting the technical window of the requirements. Your proposed solutions are not competing with other
revenue-generating solutions, but merely with each other to lose the least amount of cash. Note that operations of this sort are called "Cost
Centers" (as opposed to "Profit Centers") and are always looked down upon. Better to show that your project will actually make money, if at
all possible.
Finally, always consider the reputation and image of your organization. If your short-term profits soar but your good name suffers, you might be
in trouble in the long run through loss of other business. Will you be teaming with someone your customers cannot abide? Are you selling
to your best customer's prime competition? These do not necessarily make a project untenable, but they do indicate that you should give
it some serious thought.
These musings are excerpted from the article "Sell Your Project!" by John Cesarone, Ph.D., P.E., available at:
http://EngineeringSolutions.homestead.com/cba_article.html