Fillable Printable Control Chart Samole
Fillable Printable Control Chart Samole
Control Chart Samole
QUAN 6610
Tool: Control Chart 1
Slide 1Slide 1
Choosing the Appropriate Control Chart
(MJ II, p. 37)
Attribute (counts Variable (measurable)
or classification)
Defect Defective
(count) (classification)
The Lean Six Sigma
Pocket Toolbook, p. 123.
Slide 2Slide 2
Different types of control charts
Attribute (or count) data
Situation Chart Control Limits
Number of
defects,
accidents or
flaws
# of accidents/week
# of
breakdowns/week
# of flaws on a
product
C
U
source: Brian Joiner, Fourth Generation Management, p. 266-267.
Lean Six Sigma Pocket Toolbook, p. 132.
Slide 3Slide 3
Different types of control charts
Attribute (or classification) data
Situation Chart Control Limits
Fraction of
defectives
fraction of orders not
processed perfectly
on first trial (first pass
yield)
fraction of requests
not processed within
15 minutes
p
np
source: Brian Joiner, Fourth Generation Management, p. 266-267.
Lean Six Sigma Pocket Toolbook, p. 132.
Slide 4Slide 4
Different types of control charts
Variables (or measurement ) data
Situation Chart Control Limits
Variables data,
sets of
measurements
Xbar and R
Charts
source: Brian Joiner, Fourth Generation Management, p. 266-267.
RAX
2
±
RDLCL
RDUCL
3
4
=
=
X-”BAR” CHART
R CHART
See MJ II p. 42 for constants
A
2
, D
3
and D
4
.
Lean Six Sigma Pocket Toolbook, p. 127.
Slide 5Slide 5
Number of
Observations
in Subgroup
(
n
)
Factor for X-
bar Chart
(
A
2
)
Factor for
Lower
control Limit
in R chart
(
D
3
)
Factor for
Upper
control limit
in R chart
(
D
4
)
Factor to
estimate
Standard
deviation, (
d
2
)
2 1.88 0 3.27 1.128
3 1.02 0 2.57 1.693
4 0.73 0 2.28 2.059
5 0.58 0 2.11 2.326
6 0.48 0 2.00 2.534
7 0.42 0.08 1.92 2.704
8 0.37 0.14 1.86 2.847
9 0.34 0.18 1.82 2.970
10 0.31 0.22 1.78 3.078
Parameters for Creating X-bar Charts
Lean Six Sigma Pocket Toolbook, p. 128.
Slide 6Slide 6
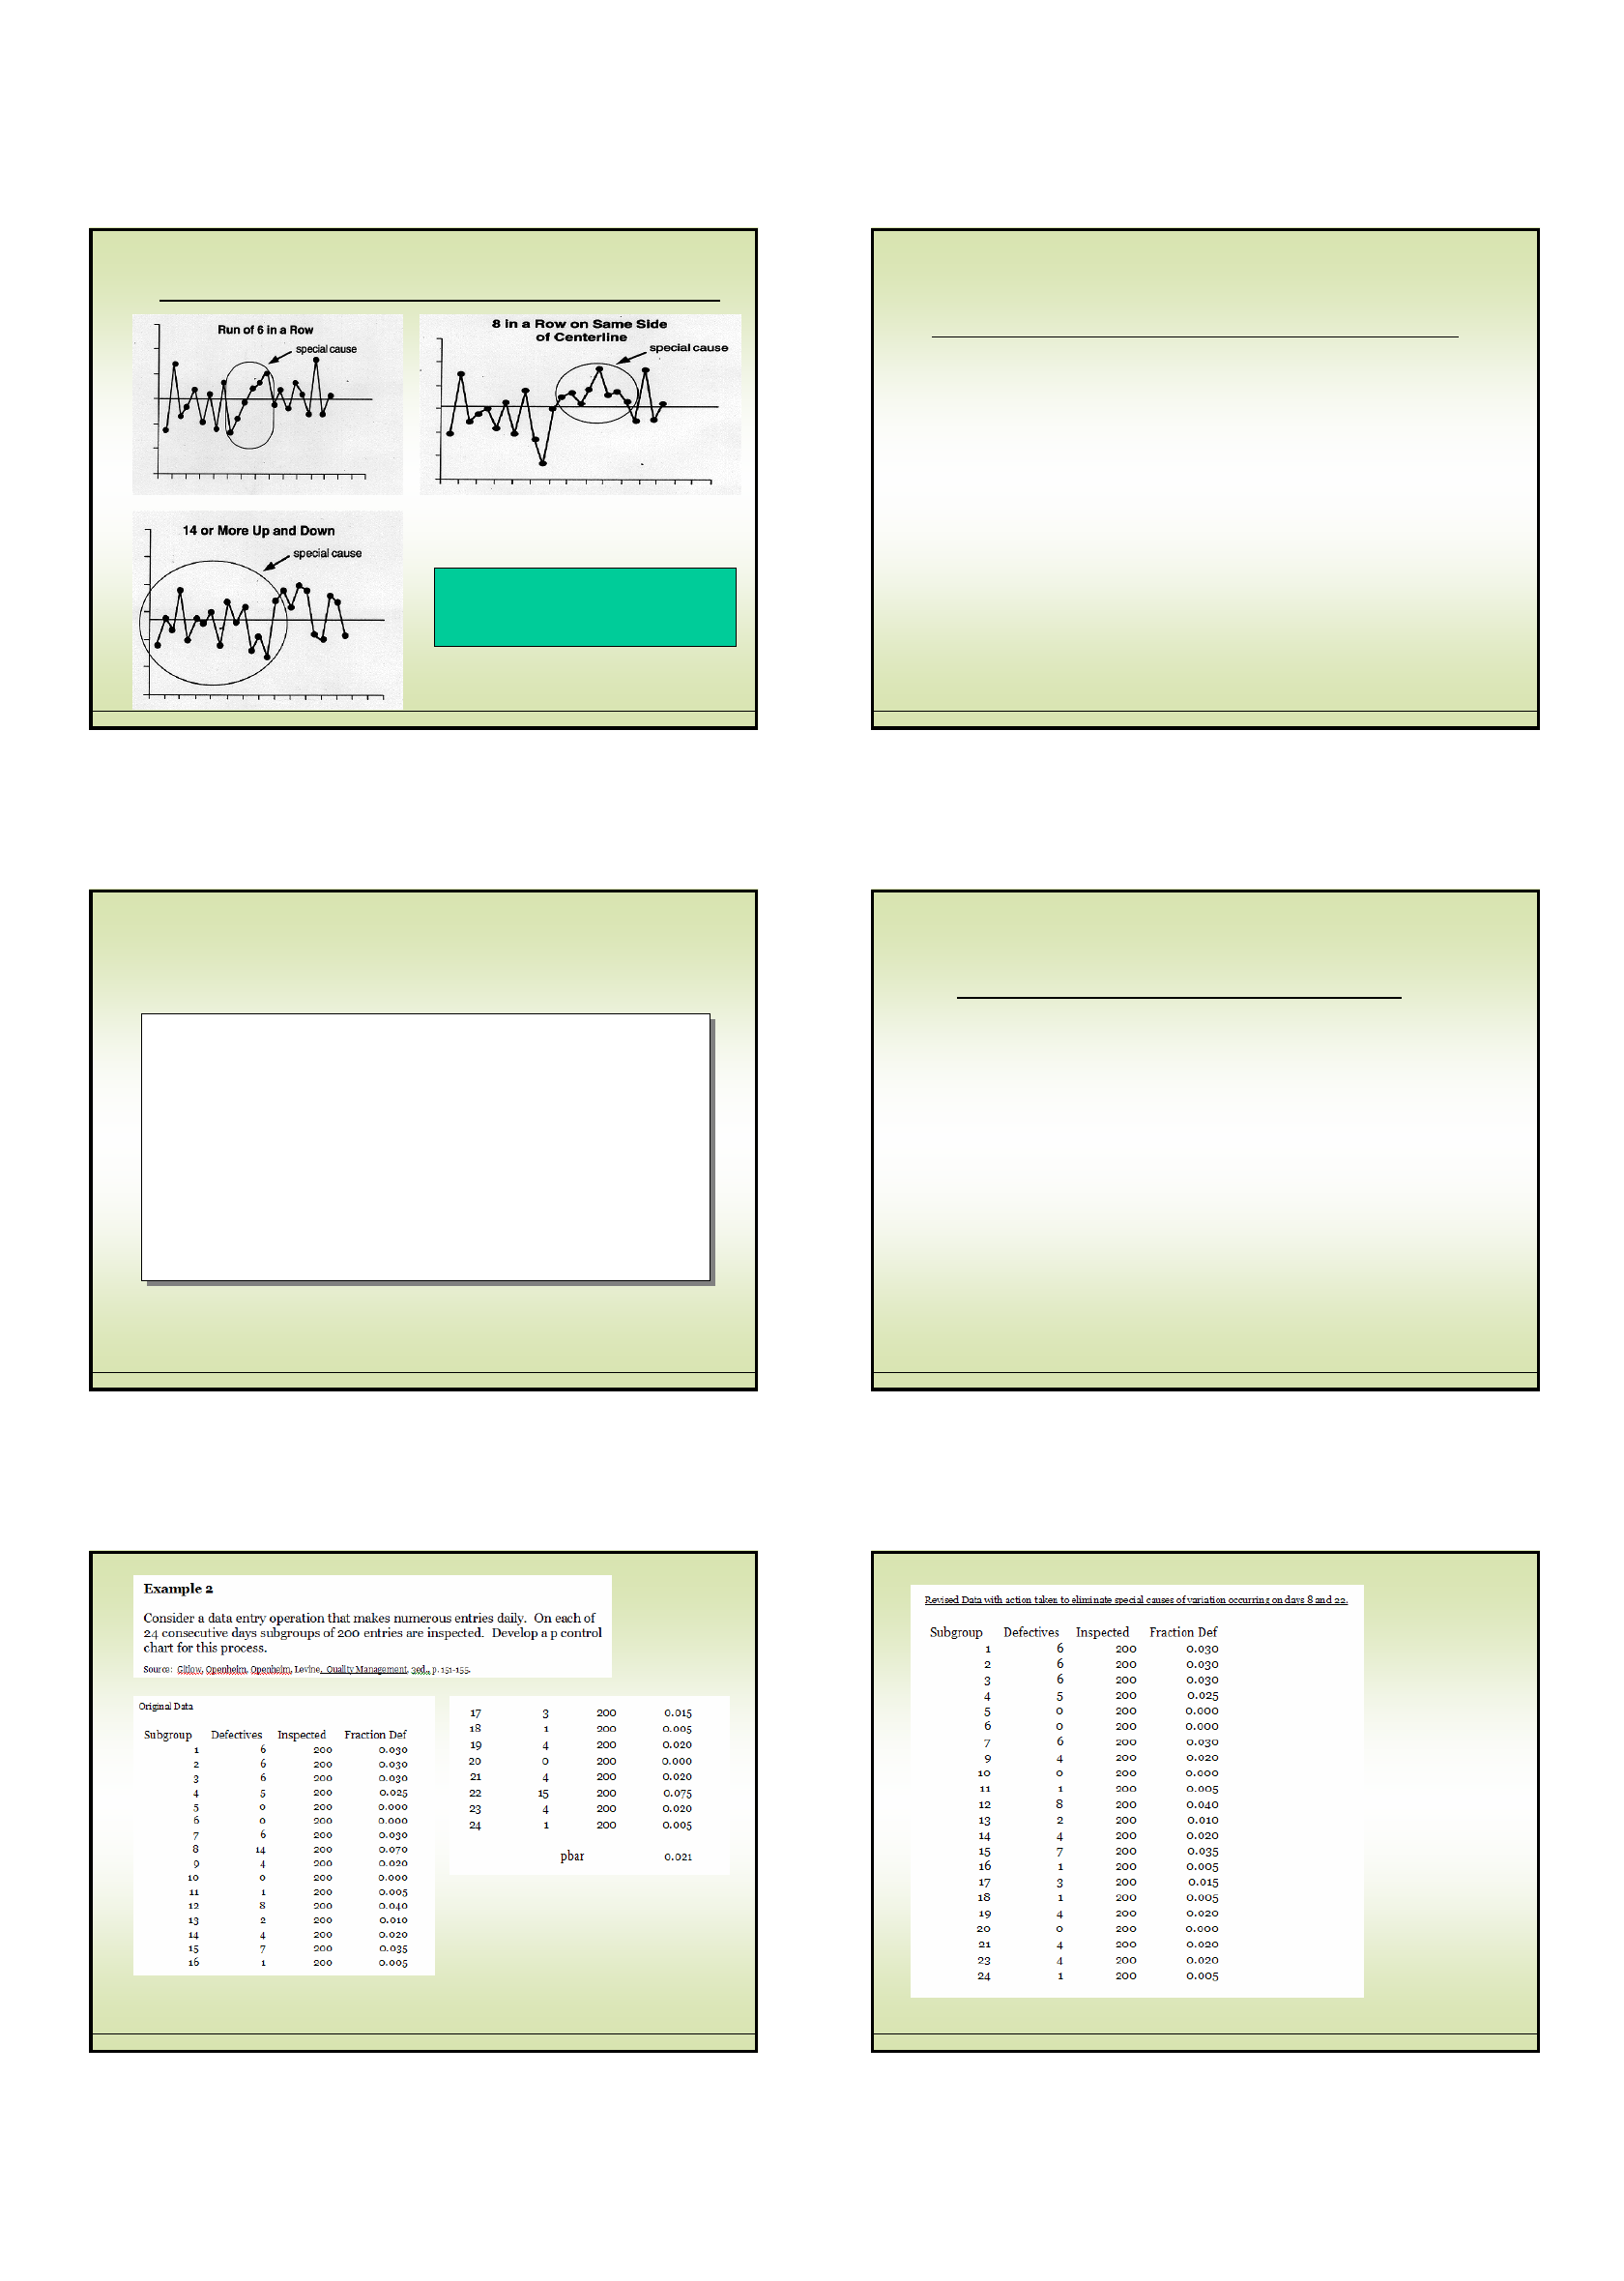
Exercise An automatic filling machine is used to fill 16
ounce cans of a certain product. Samples of size 5 are
taken from the assembly line each hour and measured.
The results of the first 25 subgroups are shown in the
attached file with selected rows shown below.
Does the process appear to be in statistical control?
Source: Shirland, Statistical Quality Control, problem 5.2.
Filling Weights
subgroup 1 2 3 4 5 Average
Range
1 16.09 16.16 16.08 16.02 16.11 16.09 0.14
2 15.95 16.00 15.90 16.17 16.01 16.01 0.27
3 16.07 16.07 16.08 15.89 16.28 16.08 0.39
4 16.13 16.15 16.19 16.13 16.19 16.16 0.06
5 16.16 16.11 16.40 16.14 15.86 16.13 0.54
Sample
If the specification limits are USL = 16.539 and LSL = 15.829 is the
process capable?
QUAN 6610
Tool: Control Chart 2
Slide 7Slide 7
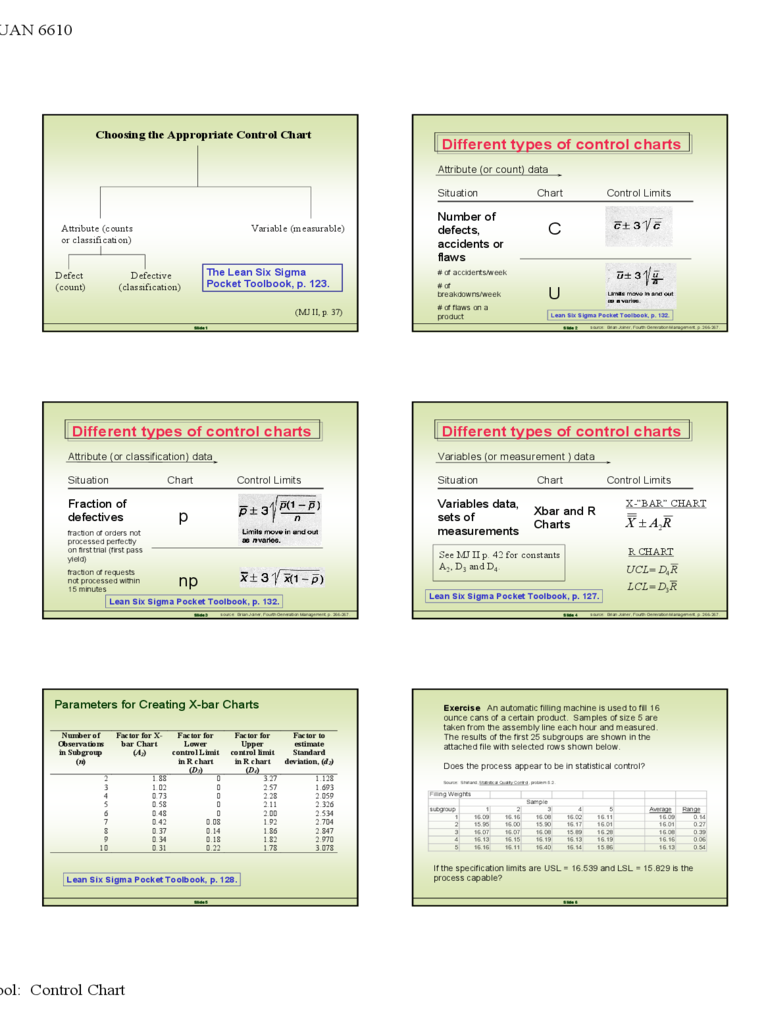
Identifying Special Causes of Variation
source: Brian Joiner, Fourth Generation Management, pp. 260.
See also Lean Six Sigma
Pocket Toolbook, p. 133-135.
Slide 8Slide 8
Strategies for Reducing Special Causes of Variation
• Get timely data so special causes are signaled
quickly.
• Put in place an immediate remedy to contain any
damage.
• Search for the cause -- see what was different.
• Develop a longer term remedy.
source: Brian Joiner, Fourth Generation Management, pp. 138-139.
Slide 9Slide 9
“In a common cause
situation, there is no such
thing as THE cause.”
Brian Joiner
Slide 10Slide 10
Improving a Stable Process
• Stratify -- sort into groups or categories; look for
patterns. (e.g., type of job, day of week, time, weather,
region, employee, product, etc.)
• Experiment -- make planned changes and learn from
the effects. (e.g., need to be able to assess and learn
from the results -- use PDCA .)
• Disaggregate -- divide the process into component
pieces and manage the pieces. (e.g., making the
elements of a process visible through measurements
and data.)
source: Brian Joiner, Fourth Generation Management, pp. 140-146.
Slide 11Slide 11 Slide 12Slide 12
QUAN 6610
Tool: Control Chart 3
Slide 13Slide 13
Advantages of Statistical Control
1. Can predict its behavior.
2. Process has an identity.
3. Operates with less variability.
4. A process having special causes is unstable.
5. Tells workers when adjustments should not be made.
6. Provides direction for reducing variation.
7. Plotting of data allows identifying trends over time.
8. Identifies process conditions that can result in an
acceptable product.
source: Juran and Gryna, Quality Planning and Analysis, p. 380-381.
Slide 14Slide 14
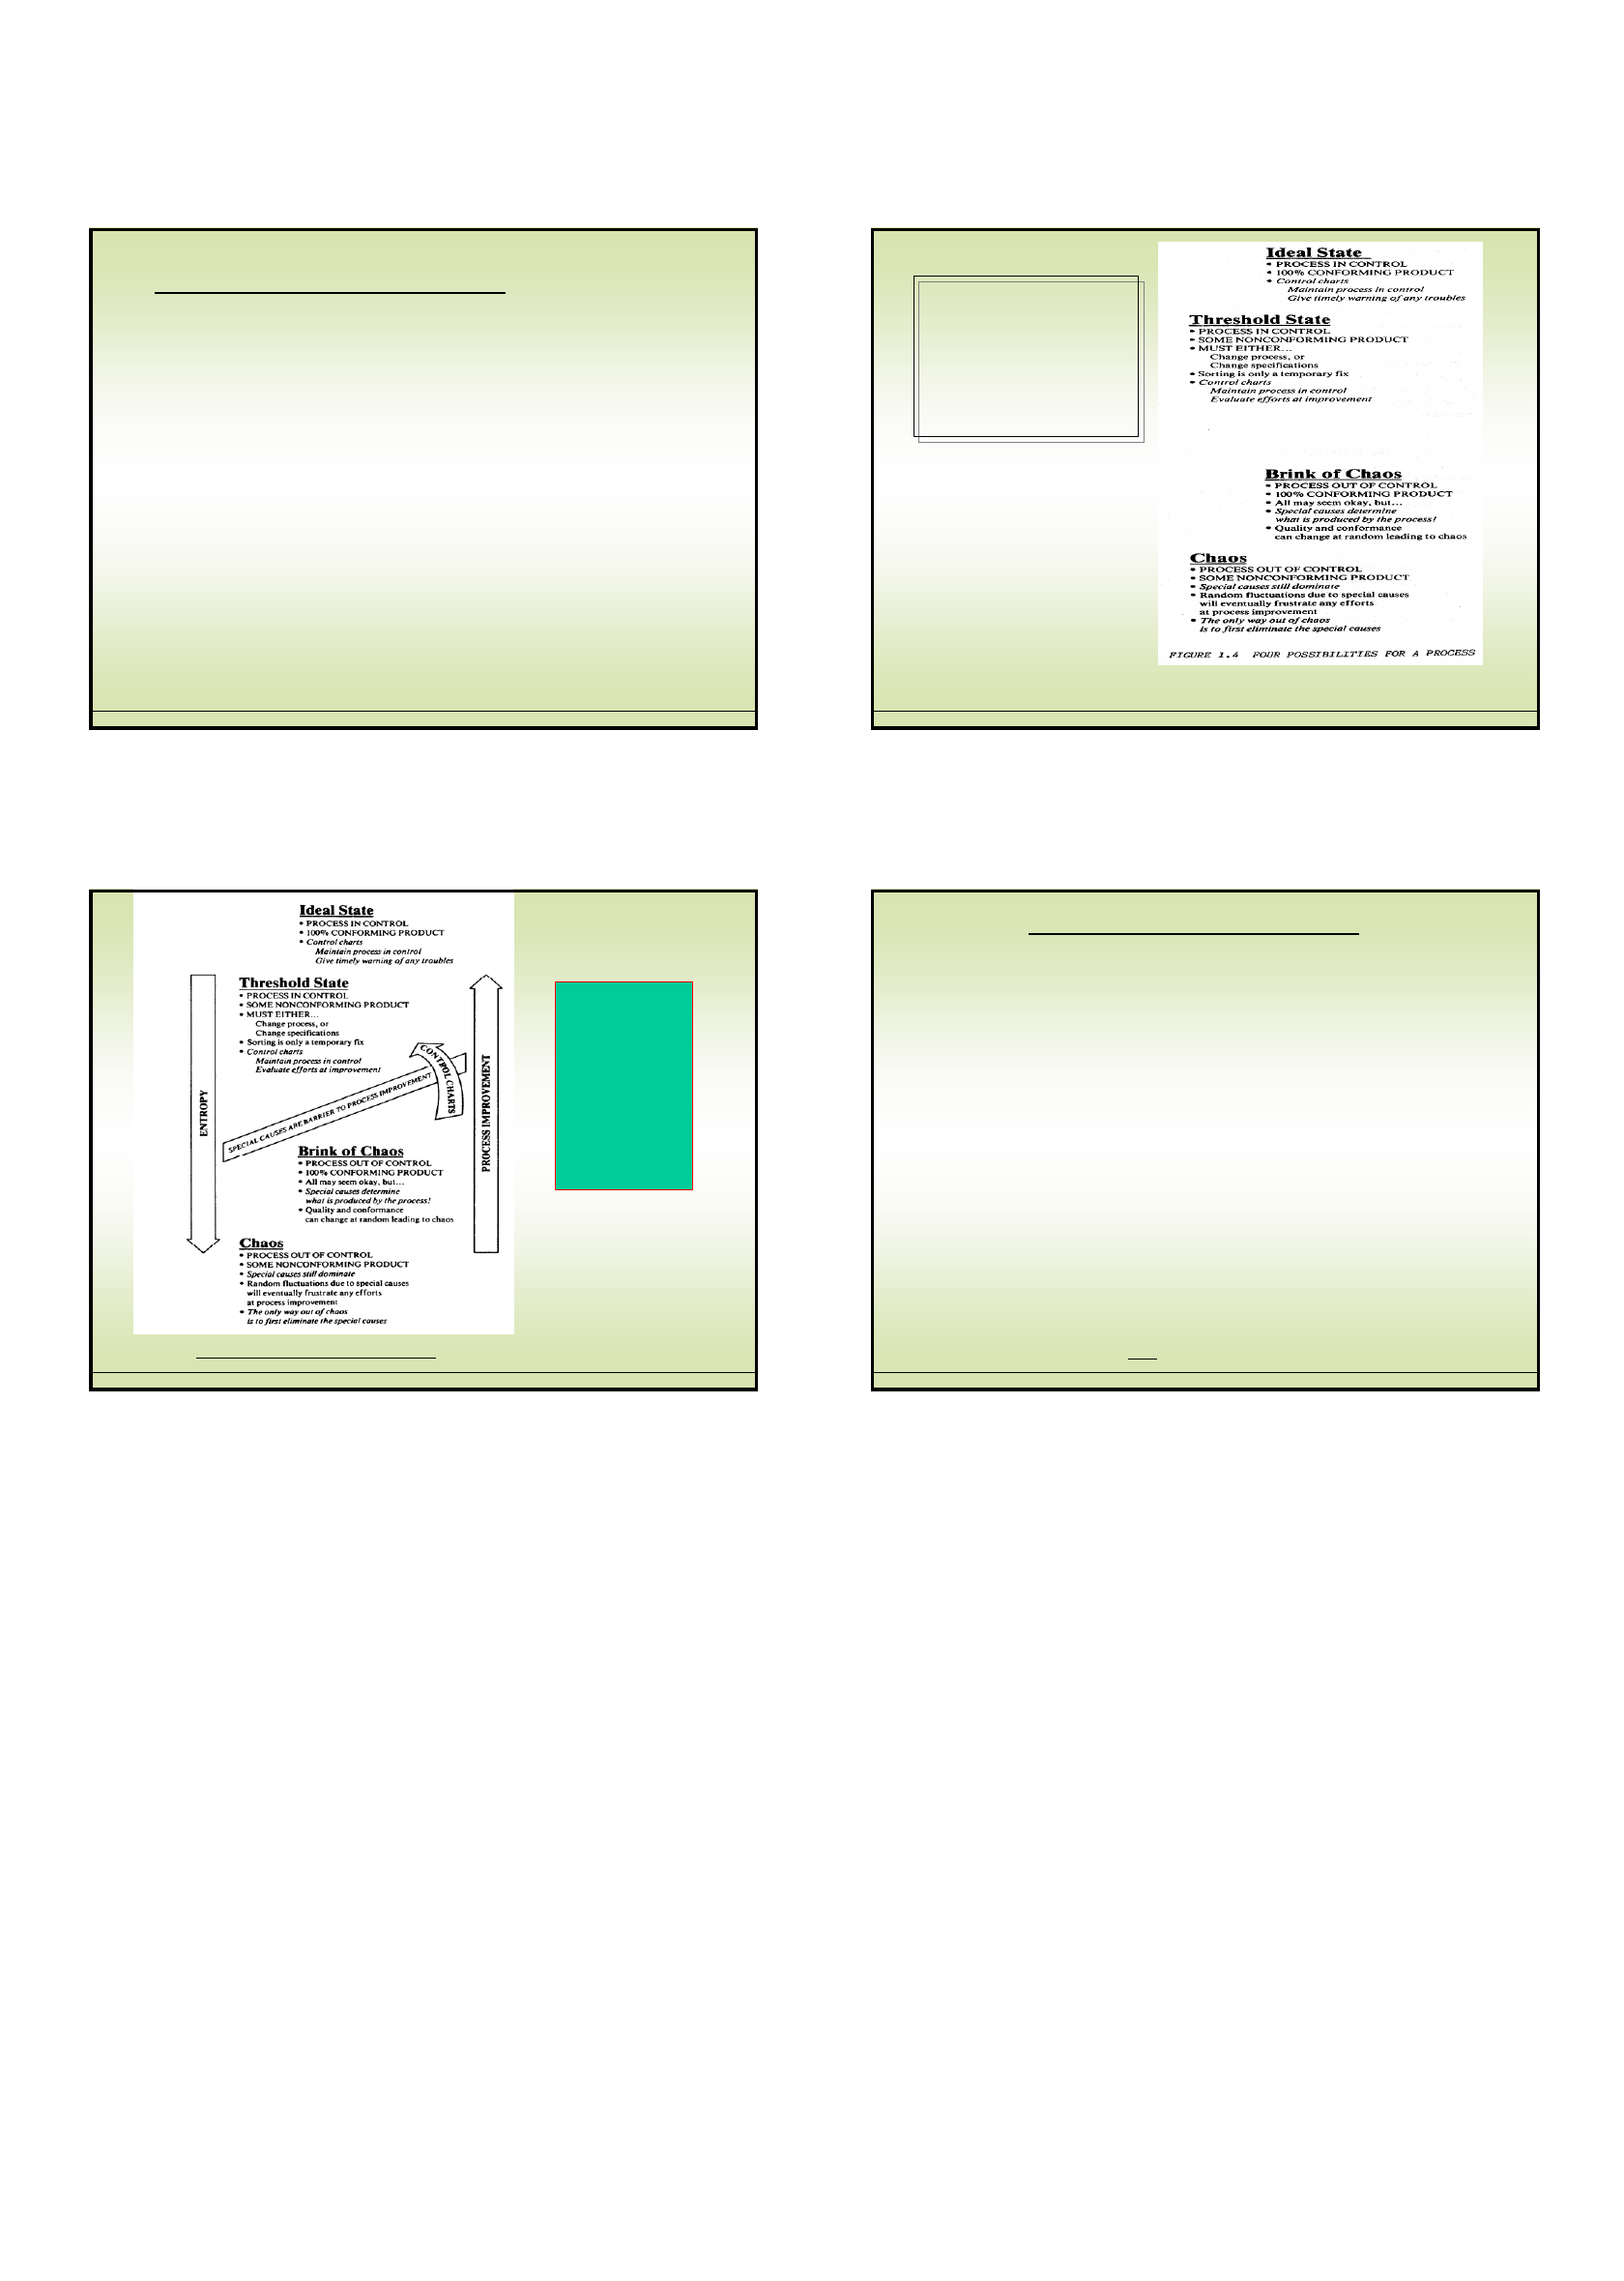
Conceptual
view
of SPC
source: Donald Wheeler, Understanding Statistical Process Control
Slide 15Slide 15
Process
Stability
vs.
Process
Capability
Wheeler, Understanding Statistical Process Control
Slide 16Slide 16
“Take this example: In finance we set a budget. The actual expenditure, month by
month, varies - we bought enough stationery for three months, and that’s going to be
a miniblip in the figures. Now, the statistician goes a step further and says, ‘How do
you know whether it’s a miniblip or there’s a real change here?’ The statistician says,
‘I’ll draw you a pair of lines here. These lines are such that 95% of the time, you’re
going to get variation between them.’
Now suppose something happens that’s clearly outside the lines. The odds are
something’s amok. Ordinarily this is the result of something local, because the
system is such that it operates in control. So supervision converges on the scene to
restore the status quo.
Notice the distinction between what’s chronic [common cause] and what’s sporadic
[special cause]. Sporadic events we handle by the control mechanism. Ordinarily
sporadic problems are delegable because the origin and remedy are local. Changing
something chronic requires creativity, because the purpose is to get rid of the status
quo - to get rid of waste. Dealing with chronic requires structured change, which has
to originate pretty much at the top.”
A Conversation with Joseph Juran
Source: A Conversation with Joseph Juran, Thomas Stewart, Fortune, January 11, 1999, p. 168-170.