Fillable Printable Sample C Control Chart
Fillable Printable Sample C Control Chart
Sample C Control Chart
Graphics Commands C CONTROL CHART
DATAPLOT Reference Manual March 3, 1997 2-43
C CONTROL CHART
PURPOSE
Generates a (Poisson) counts control chart.
DESCRIPTION
A C chart is a data analysis technique for determining if a measurement process has gone out of statistical control. The C chart is
sensitive to changes in the number of defective items in the measurement process. The “C” in C CONTROL CHART stands for
“counts” as in defectives per lot. The C control chart consists of:
Vertical axis = the number defective for each sub-group;
Horizontal axis = sub-group designation.
The C chart assumes that each sub-group has an equal sample size (this sample size does not need to be specified). A sub-group is
typically a time sequence (e.g., the number of defectives in a daily production run where each day is considered a sub-group). If the
times are equally spaced, the horizontal axis variable can be generated as a sequence (e.g., LET X = SEQUENCE 1 1 N where N is the
number of sub-groups).
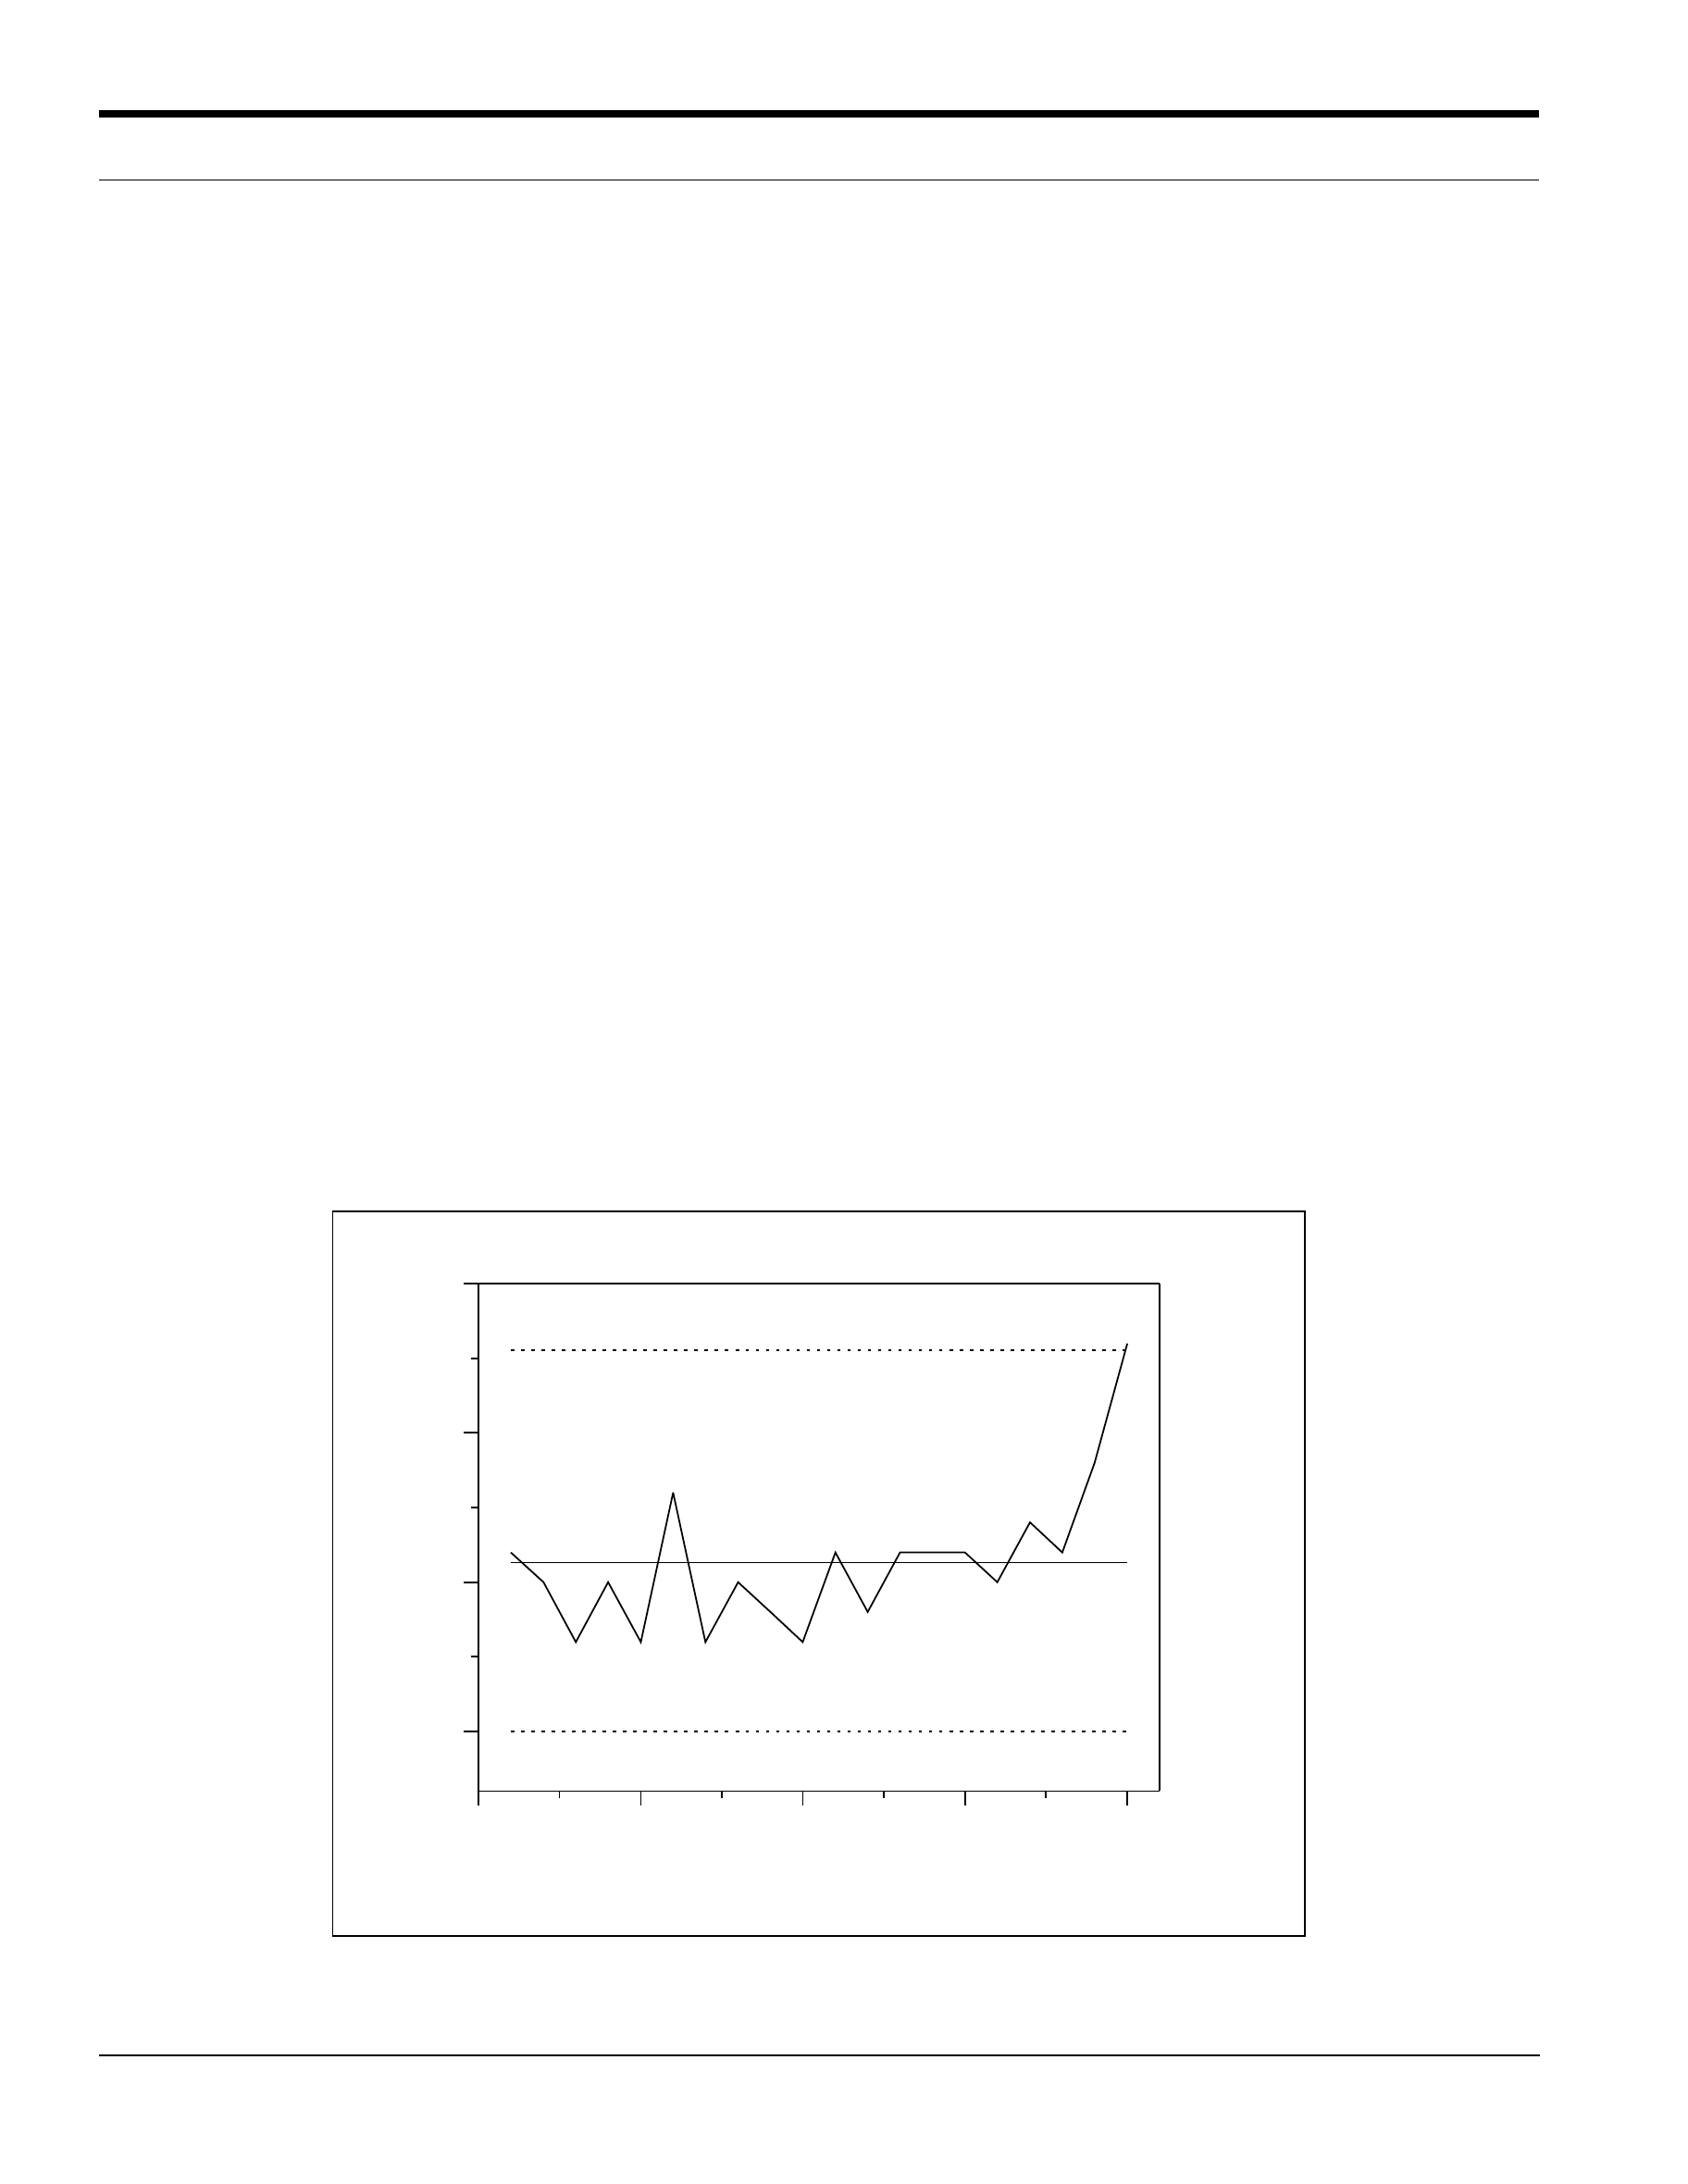
In addition, horizontal lines are drawn at the mean number of defecti ves and at the upper and lo wer control limits. The control limits are
calculated as:
(EQ 2-4)
(EQ 2-5)
where
c is the mean number of defectives. Also, zero serves as a lower bound on the LCL.
SYNTAX
C CONTROL CHART <y1> <x> <SUBSET/EXCEPT/FOR qualification>
where <y1> is a variable containing the number of defective items in each sub-group;
<x> is a variable containing the sub-group identifier (usually 1, 2, 3, ...);
and where the <SUBSET/EXCEPT/FOR qualification> is optional.
EXAMPLES
C CONTROL CHART Y X
C CONTROL CHART D X SUBSET X > 2
NOTE 1
The distribution of the number of defective items is assumed to be Poisson. This assumption is the basis for the calculating the upper
and lower control limits.
NOTE 2
The U CONTROL CHART is similar to the C CONTROL chart. The distinction is that the C CONTROL CHART is used when the
material being measured is constant in area and the sub-groups have equal size. The U CONTR OL CHART is used when either of these
assumptions is not valid.
NOTE 3
The attributes of the 4 traces that make up the C control chart are controlled by the standard LINES, CHARACTERS, SPIKES, and
BAR commands. Trace 1 is the response variable, trace 2 is the mean line, and traces 3 and 4 are the upper and lower control limits.
Some analysts prefer to draw the response variable as a character or a spike rather than a connected line. The example program
demonstrates setting the line attributes (the control lines are drawn as dotted lines).
DEFAULT
None
SYNONYMS
C CHART for C CONTROL CHART
RELATED COMMANDS
U CHART = Generates a U control chart.
L
CL c 3
c–=
UCL c 3
c+=
C CONTROL CHART Graphics Commands
2-44 March 3, 1997 DATAPLOT Reference Manual
P CHART = Generates a P control chart.
NP CHART = Generates an Np control chart.
CONTROL CHART = Generates a mean, standard deviation, or range control chart.
Q CONTROL CHART = Generates Quesenberry style control charts.
CHARACTERS = Sets the types for plot characters.
LINES = Sets the types for plot lines.
SPIKES = Sets the on/off switches for plot spikes.
PLOT = Generates a data or function plot.
REFERENCE
“Guide to Quality Control,” Kaoru Ishikawa, Asian Productivity Organization, 1982 (Chapter 8).
APPLICATIONS
Quality Control
IMPLEMENTATION DATE
88/2
PROGRAM
SKIP 25
READ CCC.DAT X NUMDEF SIZE
TITLE AUTOMATIC
LINES SOLID SOLID DOT DOT
Y1LABEL NUMBER OF DEFECTIVES
XLABEL SAMPLE ID
XLIMITS 0 20
XTIC OFFSET 0 1
YLIMITS 0 15
YTIC OFFSET 2 0
C CONTROL CHART NUMDEF SIZE X
0 5 10 15 20
0
5
10
15
C CONTROL CHART NUMDEF SIZE X
SAMPLE ID
NUMBER OF DEFECTIVES