Fillable Printable Consumers Use Cost Benefit Analysis In Order To Maximize What
Fillable Printable Consumers Use Cost Benefit Analysis In Order To Maximize What
Consumers Use Cost Benefit Analysis In Order To Maximize What

1
Cost-Effectiveness Analysis
Henry A. Glick, Ph.D.
Pharmacoeconomics
September 18, 2013
Outline
• Introduction to cost-effectiveness analysis (CEA)
• Choice criteria for CEA
• The cost-effectiveness frontier
• Net benefits (a transformation of CEA) and choice
criteria
• Additional topics
Cost-Effectiveness Analysis (I)
• Estimates costs and outcomes of intervention
• Costs and outcomes are expressed in different units
– If outcomes aggregated using measures of
preference (e.g., quality-adjusted life years saved),
referred to as cost utility analysis
www.uphs.upenn.edu/dgimhsr/fda2013.htm

2
Cost-Effectiveness Analysis (II)
• Results meaningful if:
– Compared with other accepted and rejected
interventions (e.g., against league tables), or
– There exists a predefined standard (i.e., a threshold
or maximum acceptable cost-effectiveness ratio or an
acceptability criterion) against which they can be
compared
• e.g., $50,000 per year of life saved might be
considered maximum acceptable ratio, or
– Can define utility curves that trade off health and cost
Cost-Effectiveness “History”
• $/Life saved
• $/Year of life saved (YOL)
• $/Quality adjusted life year saved (QALY)
• ??? Outlawing QALYs ???
Why CEA Rather Than CBA?
• Not precisely clear
– Potential difficulties in measurement
– Discomfort with placing a dollar value directly on a
particular person's life (rather than years of life in
general)
– QALYs / life years more equally distributed than
wealth
– Health more a “right” than a commodity
• Implies 1 person 1 vote may be more appropriate
than 1 dollar 1 vote
• Cost-effectiveness analysis uses 1 QALY/year
1 vote

3
Cost-Effectiveness Ratios
• Cost-effectiveness ratio
• A ratio exists for every pair of options
– 1 option (case series), no ratios calculated
– 2 options, 1 ratio
– 3 options, 3 ratios (option 1 versus option 2, option 1
versus option 3, and option 2 versus option 3)
• In “efficient” selection algorithm, don’t necessarily
calculate all possible ratios
1 2
1 2
Costs - Costs
Effects - Effects
Average Cost-Effectiveness Ratio
• Some dispute about definitions
– e.g., Some use “average cost-effectiveness ratio” to
refer to practice of dividing therapy’s total cost by its
total effect (including Treeage, a fairly ubiquitous
piece of decision analysis software)
• Don’t use this definition of average CER
• Recommend against dividing a therapy’s total cost by its
total effect
– These ratios provide little to no information
Dividing a Therapy’s Costs by Its Effects is
“Generally Uninformative”
Cost Effect Ratio
Example 1
Rx1 500 .025 20,000
Rx2 780 .026 30,000
Example 2
Rx1 500 .025 20,000
Rx2 1500 .05 30,000

4
Dividing a Therapy’s Costs by Its Effects is
“Generally Uninformative”
Cost Effect Ratio
Example 1
Rx1 500 .025 20,000
Rx2 780 .026 30,000
(780-500) / (.026-.025) = 280,000
Example 2
Rx1 500 .025 20,000
Rx2 1500 .05 30,000
(1500-500) / (.05-.025) = 40,000
Average Cost-Effectivemess Ratio (2)
• Definition: Comparison of costs and effects of each
intervention with a single option, often "do nothing" or
usual care option
# Guaiac
Tests Cost Cases Detected
Avg Cost/ Case
Detected *
1 7.75 .00659469 --
2 10.77 .00714424 5495
3 13.02 .00719004 8852
4 14.81 .00719385 11,783
5 16.31 .00719417 14,279
6 17.63 .00719420 16,480
* (C
i
– C
1
) / (E
i
– E
1
)
Example: Average Ratios and Sixth Stool Guaiac
• Neuhauser and Lewicki, NEJM, 1975;293:226-8.
5
Incremental Cost-Effectiveness Ratios
• Average ratios not important when making selection from
among all candidate therapies
• ICER = comparison of costs and effects among
alternative options (i.e., excluding comparator used in
calculation of average cost-effectiveness ratios)
• When there are only 2 options being evaluated, average
and incremental cost-effectiveness ratios are identical
• Neuhauser and Lewicki, NEJM, 1975;293:226-8
.
Guaiac Average and Incremental Ratios
# Guaiac
tests Cost
Cases
Detected
Average
CER *
Increm
CER **
1 7.75 .00659469 -- --
2 10.77 .00714424 5495 5495
3 13.02 .00719004 8852 49127
4 14.81 .00719385 11,783 469,816
5 16.31 .00719417 14,279 4,687,500
6 17.63 .00719420 16,480 44,000,000
* (C
i
– C
1
) / (E
i
– E
1
)
** (C
i
– C
i-1
) / (E
i
– E
i-1
)
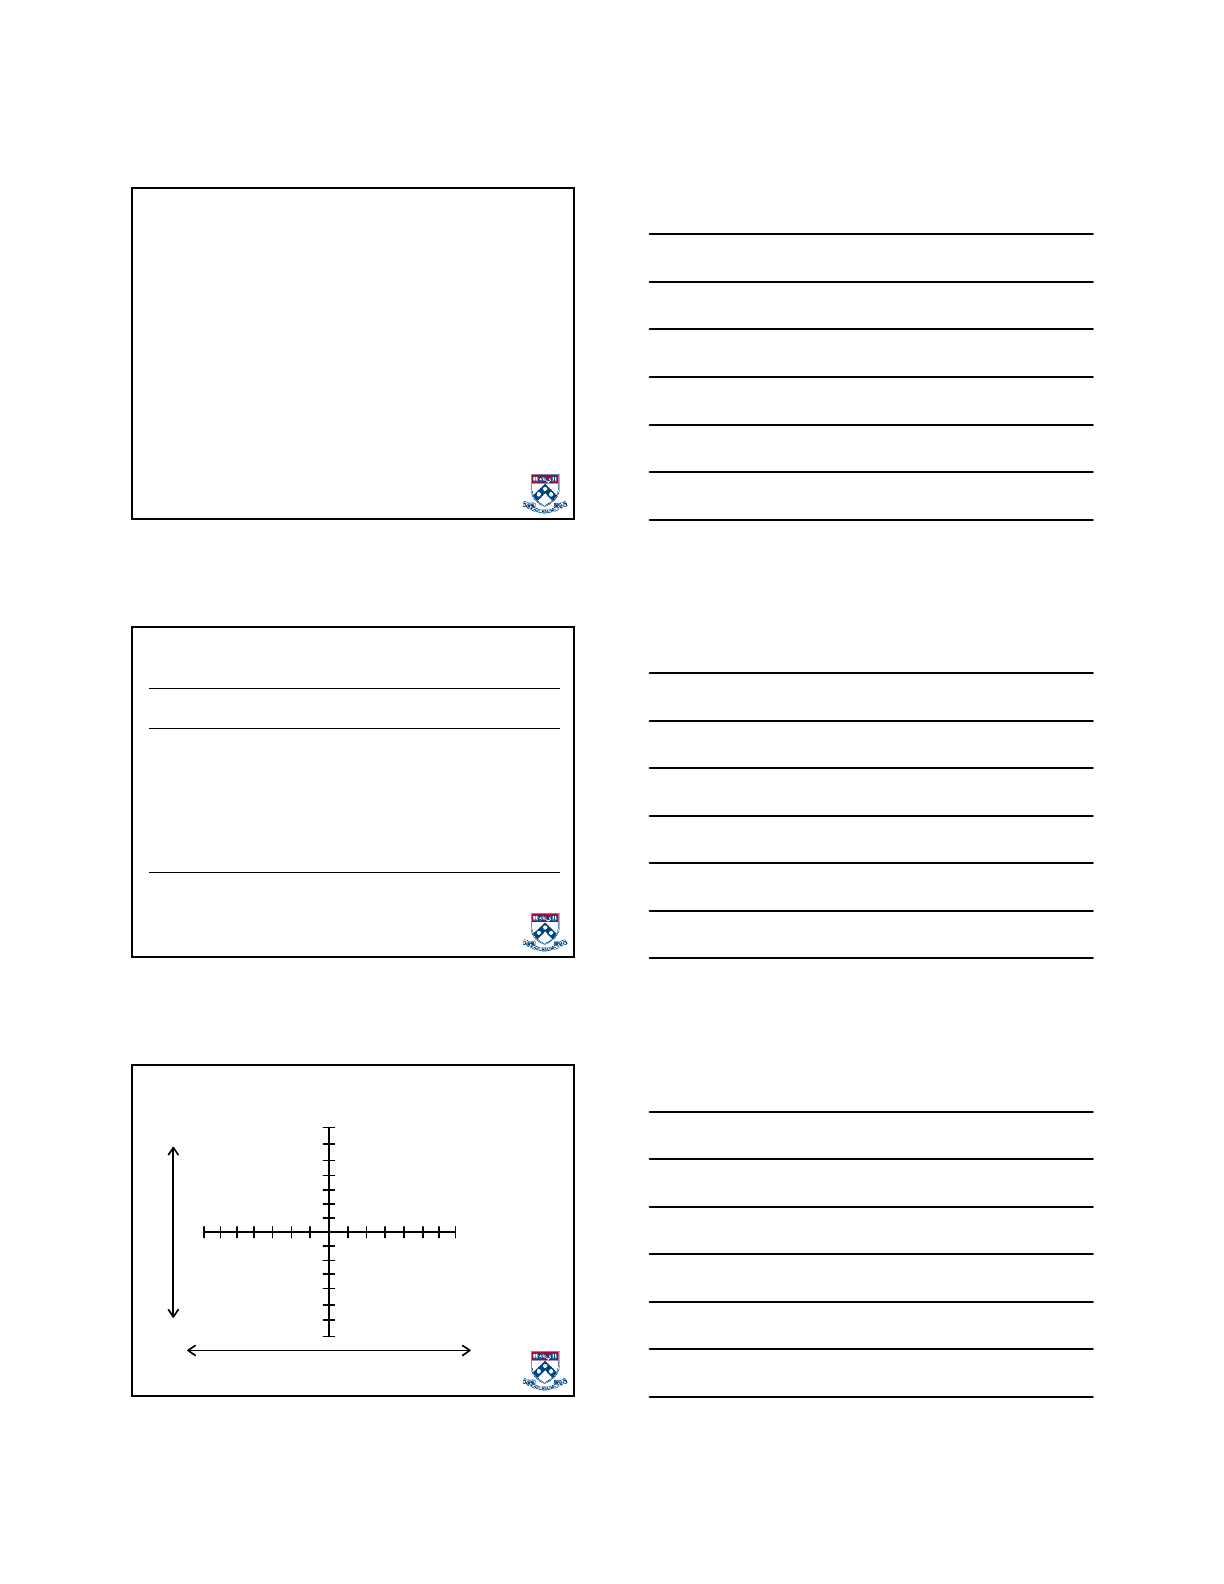
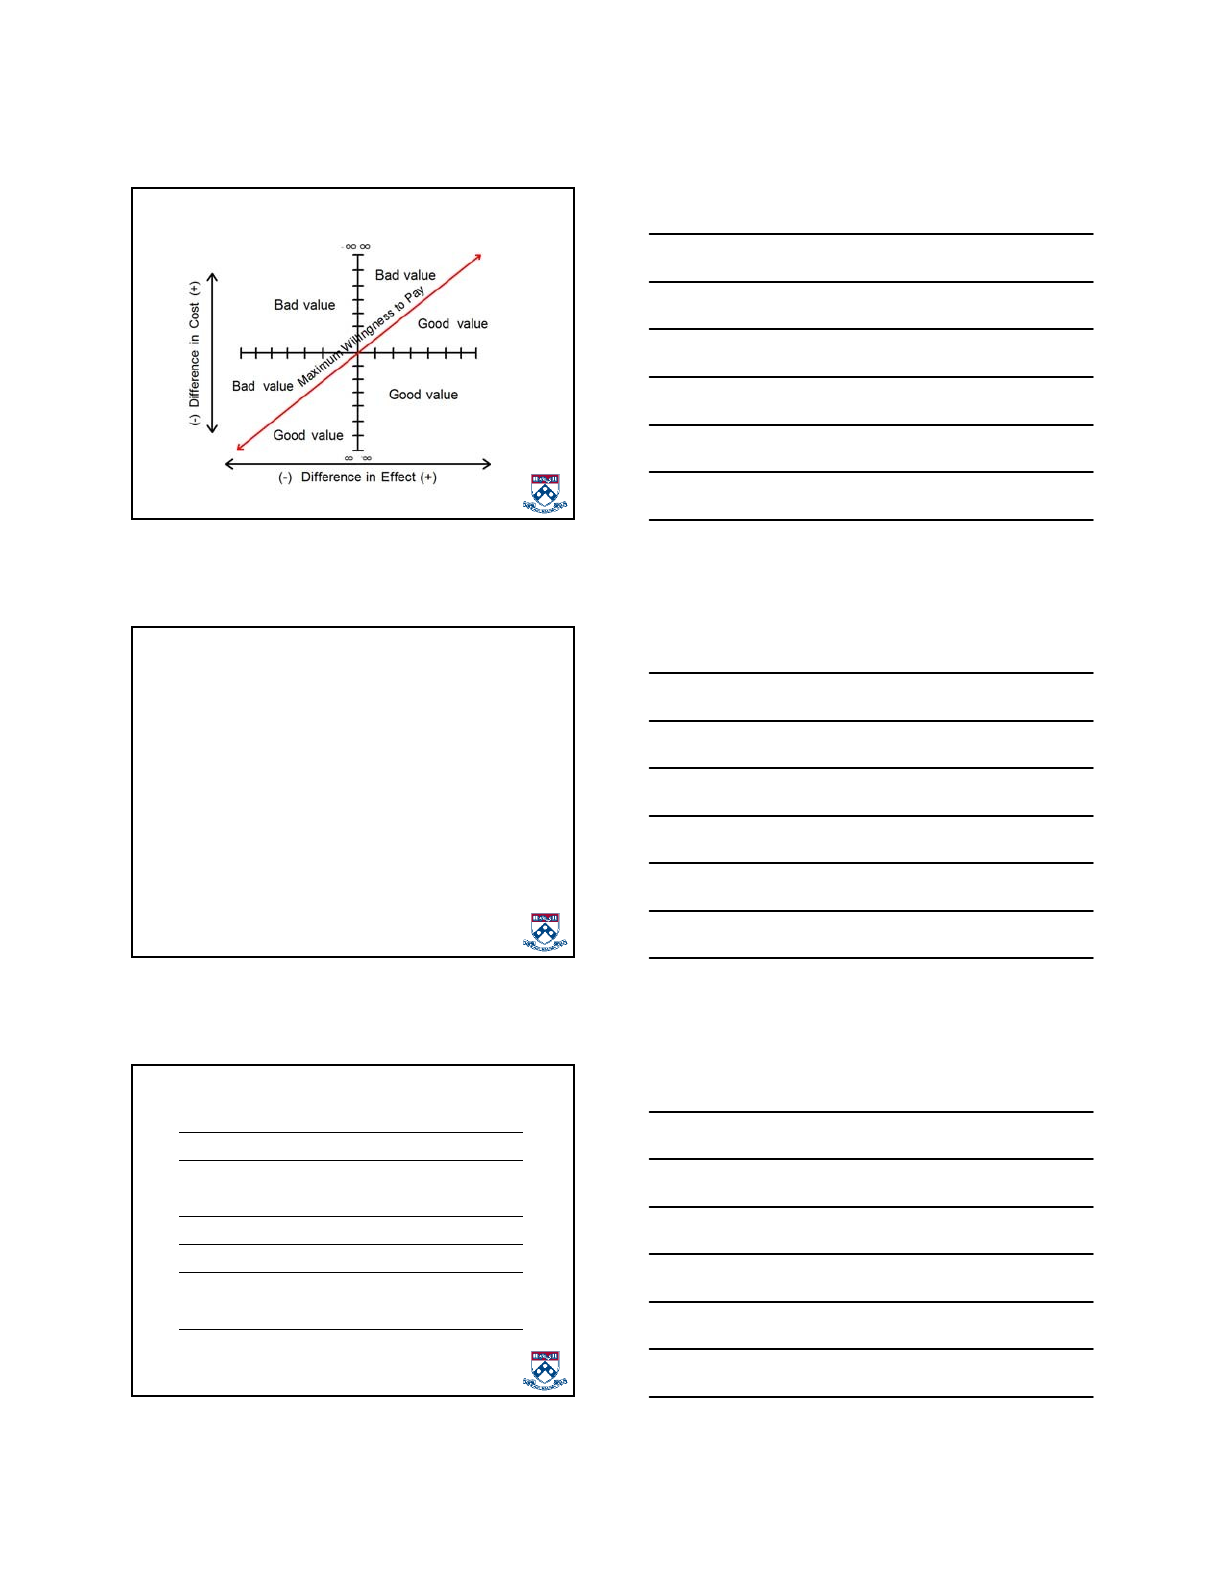
Cost-Effectiveness Plane
• Axes
• Origin
• Average
ratios
• Incremental
ratios
Alternative
therapy dominates
Alternative therapy more
effective but more costly
New therapy more
effective but more costly
New therapy
dominates
(-) Difference in Cost (+)
(-) Difference in Effect (+)
oo
oo-oo
-oo
6
Good and Bad Value
Choice Criteria For Cost-Effectiveness Ratios
• Choose options with acceptable average and
incremental cost-effectiveness ratios (i.e., whose ratios
with all other options are acceptable)
• Subject to:
– Budget Constraint?
– Acceptable Ratio?
• Not accounting for uncertainty around ratios
• Consider 3 mutually exclusive options and a willingness
to pay of 50k
Choice Criteria, Example 1
Option 1 Option 2 Option 3
Expected Costs 10,000 135,000 270,000
Expected QALYs 20 25 30
Ratios Option 2 Option 3
Option 1 25,000 26,000
Option 2 -- 27,000 Adopt?

7
Choice Criteria, Example 2
Option 1 Option 2 Option 3
Expected Costs 10,000 135,000 235,000
Expected QALYs 20 25 26
Ratios Option 2 Option 3
Option 1 25,000 37,500
Option 2 -- 100,0000 Adopt?
Choice Criteria, Example 3
Option 1 Option 2 Option 3
Expected Costs 10,000 210,000 230,000
Expected QALYs 20 21 21.5
Ratios Option 2 Option 3
Option 1 200,000 146,667
Option 2 -- 40,000 Adopt?
Multitherapy Example
• Suppose 6 screening strategies have the following
discounted costs and life expectancies:
Treatment Cost YOLS
No screening (S1) 1052 17.348
Sig Q10 (S2) 1288 17.378
Sig Q5 (S3) 1536 17.387
U+Sig, Q10 (S4) 1810 17.402
C Q(10) (S5) 2028 17.396
U+Sig, Q5 (S6) 2034 17.407
Frazier AL, et al. JAMA. 2000;284:1954-61.

8
Choice Among Screening Strategies
• Which therapy should be adopted if the acceptability
criterion is $40,000 / YOL Saved? $50,000 / YOL
Saved?
• In what follows, demonstrate 2 (of 4) methods for
selecting a single therapy from among these candidates
– Methods all based on selecting therapy with an
acceptable ratio
– Methods transformations of one another -- use same
information in slightly different ways -- and all yield
identical choices
Method 1: Efficient Algorithm (MEA) for
Choosing among Multiple Therapies (I)
• Suppose 6 therapies have the following discounted costs
and life expectancies
Treatment Cost YOLS
No screening (S1) 1052 17.348
Sig Q10 (S2) 1288 17.378
Sig Q5 (S3) 1536 17.387
U+Sig, Q10 (S4) 1810 17.402
C Q(10) (S5) 2028 17.396
U+Sig, Q5 (S6) 2034 17.407
Efficient Algorithm: Step 1
• Rank order therapies in ascending order of either
outcomes or costs (final ordering of nondominated
therapies unaffected by variable chosen)
Treatment Cost YOLS
No screening (S1) 1052 17.348
Sig Q10 (S2) 1288 17.378
Sig Q5 (S3) 1536 17.387
C Q(10) (S5) 2028 17.396
U+Sig, Q10 (S4) 1810 17.402
U+Sig, Q5 (S6) 2034 17.407

9
Efficient Algorithm: Step 2
• Eliminate therapies that are strongly dominated (i.e.,
have increased costs and reduced effects compared with
at least one other alternative)
Treatment Cost YOLS
No screening (S1) 1052 17.348
Sig Q10 (S2) 1288 17.378
Sig Q5 (S3) 1536 17.387
C Q(10) (S5) 2028 17.396
U+Sig, Q10 (S4) 1810 17.402
U+Sig, Q5 (S6) 2034 17.407
Efficient Algorithm: Step 3
• Compute incremental cost-effectiveness ratios for each
adjacent pair of outcomes (e.g., between options 1 and
2; between options 2 and 3; etc.)
Treatment Cost YOLS ICER
No screening (S1) 1052 17.348 --
Sig Q10 (S2) 1288 17.378 7867
Sig Q5 (S3) 1536 17.387 27,556
C Q(10) (S5) 2028 17.396 Dom
U+Sig, Q10 (S4) 1810 17.402 18,267
U+Sig, Q5 (S6) 2034 17.407 44,800
Efficient Algorithm: Step 4
• Eliminate therapies that are less effective (costly) but
have a higher cost-effectiveness ratio (weakly
dominated) than next highest ranked therapy
• Rationale: Rather buy more health for a lower cost per
unit than less health for a higher cost per unit
– e.g., eliminate S3 (sig,Q5), because:
• S3 is less effective than next higher ordered S4
(U+sig,Q10) [17.387 YOLS vs. 17.402] AND
• Incremental ratio for moving from S2 to S3
(27,556) is greater than incremental ratio from
moving from S3 to S4 (18,267)
– Implies that moving from S2 to S4 is more cost-
effective than is moving from S2 to S3

10
Efficient Algorithm: Step 5
• Recalculate ICERs (e.g., between options 2 and 4)
– Repeat steps 4 and 5 if necessary
Treatment Cost YOLS ICER
No screening (S1) 1052 17.348 --
Sig Q10 (S2) 1288 17.378 7867
Sig Q5 (S3) 1536 17.387 27,556
C Q(10) (S5) 2028 17.396 Dom
U+Sig, Q10 (S4) 1810 17.402 21,750
U+Sig, Q5 (S6) 2034 17.407 44,800
Efficient Algorithm: Step 6
• Identify acceptable therapy
Maximum WTP Therapy
<7867 S1
7867 to 21,749 S2
21750 to 44,799 S4
44,800+ S6
Full Cost-Effectiveness Table
Treatment Cost ∆C YOLS ∆ Y ICER
S1 No screening 1052 -- 17.348 -- --
S2 Sig Q10 1288 236 17.378 0.030 7867
S3 Sig Q5 1536 -- 17.387 -- WD
S5 C Q(10) 2028 -- 17.396 -- SD
S4 U+Sig, Q10 1810 522 17.402 0.024 21,750
S6 U+Sig, Q5 2034 224 17.407 0.005 44,800
SD = strong dominance; WD = weak dominance

11
Reduced Cost-Effectiveness Table
Treatment Cost ∆C YOLS ∆ Y ICER
S1 No screening 1052 -- 17.348 -- --
S2 Sig Q10 1288 236 17.378 0.030 7867
S4 U+Sig, Q10 1810 522 17.402 0.024 21,750
S6 U+Sig, Q5 2034 224 17.407 0.005 44,800
Introduction to Method 2: Net Benefits
• A composite measure (part cost-effectiveness, part cost
benefit analysis), usually expressed in dollar terms, that
is derived by rearranging cost-effectiveness decision
rule:
W > ∆C /∆Q
where W = willingness to pay (e.g., 50 or 100K)
Net Benefits (II)
• Two forms of net benefit expression exist depending on
rearrangement of expression
– Perhaps most naturally for economists, net monetary
benefits can be expressed on cost scale (NMB)
(W * ∆Q) - ∆C
– OR net health benefits (NHB) can be expressed on
health outcome scale:
∆Q - (∆C / W)
• Potential disadvantage: NHB undefined when WTP
equals 0