Fillable Printable Home Budget Template
Fillable Printable Home Budget Template
Home Budget Template
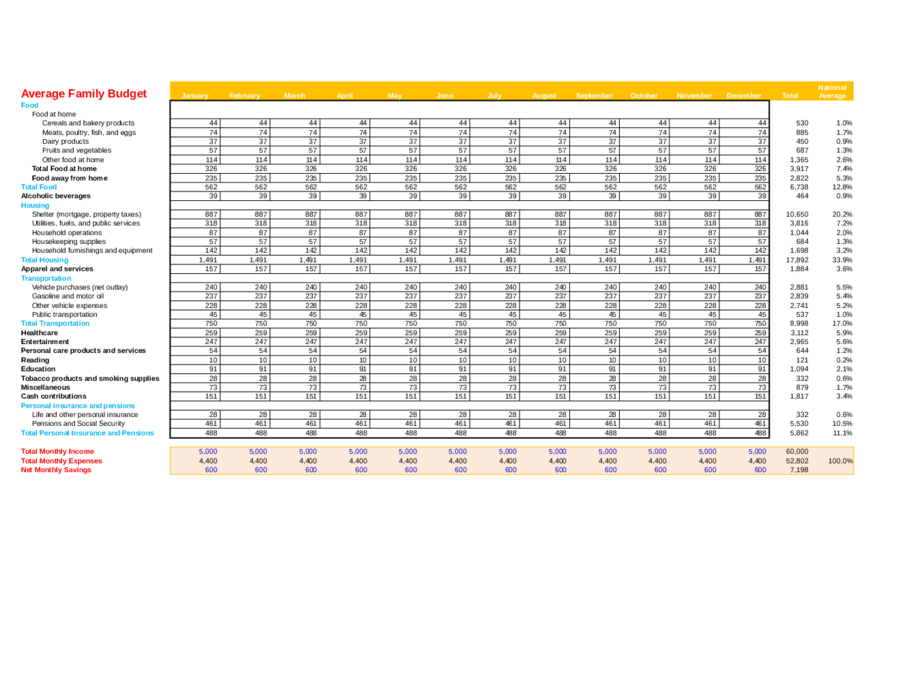
Average Family Budget
January February March April May June July August September October November December Total
Food
Food at home
Cereals and bakery products 44 44 44 44 44 44 44 44 44 44 44 44 530 1.0%
Meats, poultry, fish, and eggs 74 74 74 74 74 74 74 74 74 74 74 74 885 1.7%
Dairy products 37 37 37 37 37 37 37 37 37 37 37 37 450 0.9%
Fruits and vegetables 57 57 57 57 57 57 57 57 57 57 57 57 687 1.3%
Other food at home 114 114 114 114 114 114 114 114 114 114 114 114 1,365 2.6%
Total Food at home 326 326 326 326 326 326 326 326 326 326 326 326 3,917 7.4%
Food away from home 235 235 235 235 235 235 235 235 235 235 235 235 2,822 5.3%
Total Food 562 562 562 562 562 562 562 562 562 562 562 562 6,738 12.8%
Alcoholic beverages 39 39 39 39 39 39 39 39 39 39 39 39 464 0.9%
Housing
Shelter (mortgage, property taxes) 887 887 887 887 887 887 887 887 887 887 887 887 10,650 20.2%
Utilities, fuels, and public services 318 318 318 318 318 318 318 318 318 318 318 318 3,816 7.2%
Household operations 87 87 87 87 87 87 87 87 87 87 87 87 1,044 2.0%
Housekeeping supplies 57 57 57 57 57 57 57 57 57 57 57 57 684 1.3%
Household furnishings and equipment 142 142 142 142 142 142 142 142 142 142 142 142 1,698 3.2%
Total Housing 1,491 1,491 1,491 1,491 1,491 1,491 1,491 1,491 1,491 1,491 1,491 1,491 17,892 33.9%
Apparel and services 157 157 157 157 157 157 157 157 157 157 157 157 1,884 3.6%
Transportation
Vehicle purchases (net outlay) 240 240 240 240 240 240 240 240 240 240 240 240 2,881 5.5%
Gasoline and motor oil 237 237 237 237 237 237 237 237 237 237 237 237 2,839 5.4%
Other vehicle expenses 228 228 228 228 228 228 228 228 228 228 228 228 2,741 5.2%
Public transportation 45 45 45 45 45 45 45 45 45 45 45 45 537 1.0%
Total Transportation 750 750 750 750 750 750 750 750 750 750 750 750 8,998 17.0%
Healthcare 259 259 259 259 259 259 259 259 259 259 259 259 3,112 5.9%
Entertainment 247 247 247 247 247 247 247 247 247 247 247 247 2,965 5.6%
Personal care products and services 54 54 54 54 54 54 54 54 54 54 54 54 644 1.2%
Reading 10 10 10 10 10 10 10 10 10 10 10 10 121 0.2%
Education 91 91 91 91 91 91 91 91 91 91 91 91 1,094 2.1%
Tobacco products and smoking supplies 28 28 28 28 28 28 28 28 28 28 28 28 332 0.6%
Miscellaneous 73 73 73 73 73 73 73 73 73 73 73 73 879 1.7%
Cash contributions 151 151 151 151 151 151 151 151 151 151 151 151 1,817 3.4%
Personal insurance and pensions
Life and other personal insurance 28 28 28 28 28 28 28 28 28 28 28 28 332 0.6%
Pensions and Social Security 461 461 461 461 461 461 461 461 461 461 461 461 5,530 10.5%
Total Personal Insurance and Pensions 488 488 488 488 488 488 488 488 488 488 488 488 5,862 11.1%
Total Monthly Income 5,000 5,000 5,000 5,000 5,000 5,000 5,000 5,000 5,000 5,000 5,000 5,000 60,000
Total Monthly Expenses 4,400 4,400 4,400 4,400 4,400 4,400 4,400 4,400 4,400 4,400 4,400 4,400 52,802 100.0%
Net Monthly Savings 600 600 600 600 600 600 600 600 600 600 600 600 7,198
National
Average

Instructions
Using this average family budget spreadsheet is very straightforward. This spreadsheet only requires two sets of inputs.
The worksheet takes your monthly after tax income (row 40) and desired net monthly savings (row 42) to develop a monthly
expense value that appears on row 41. The National Average family budget information that appears in column O is then
used to spread the total monthly expenses to each of the thirty five budget categories.
This average family budget spreadsheet is intended to show you what an average family's expenses would look like each
month - by category. This spreadsheet is intended to be used along with, and compared to, the Family Budget spreadsheet.
Copyright © 2011 - 2015 Money-zine.com