Fillable Printable Monthly Business Report - Auckland Transport
Fillable Printable Monthly Business Report - Auckland Transport
Monthly Business Report - Auckland Transport
MONTHLY BUSINESS REPORT
September 2010
CONTRIBUTION LIST
The following is a list of Business Unit Managers responsible for providing detailed monthly reports.
Business Unit
Name
Customer Services
Mark Lambert
Project Delivery
Allen Bufton
Strategy and Planning
Peter Clark
Marketing and Communications
Shelley Watson
Corporate Services
Stephen Smith

0
TABLE OF CONTENTS
1 CUSTOMER SERVICES ....................................................................................................... 2
1.1. PASSENGER TRANSPORT PATRONAGE – NETWORK WIDE .......................................................................................... 2
1.2. SERVICE DEVELOPMENT ................................................................................................................................................... 10
1.3. MAJOR INFRASTRUCTURE WORKS ................................................................................................................................. 11
1.4. SPECIAL EVENT PASSENGER TRANSPORT SERVICES ................................ ................................................................ . 11
1.5. REGISTERED SERVICE NOTIFICATIONS RECEIVED BY ARTA UNDER THE PUBLIC TRANSPORT
MANAGEMENT ACT 2008 ................................................................................................................................ ................... 12
1.6. PUBLIC TRANSPORT CONCESSIONARY FARE SCHEME (CFS) ................................................................................... 12
1.7. AUCKLAND TOTAL MOBILITY SCHEME ........................................................................................................................ 13
1.8. TRAVEL PLANNING ............................................................................................................................................................ 13
2 PROJECT DELIVERY ......................................................................................................... 14
2.1. INFRASTRUCTURE DEVELOPMENT ................................................................................................................................ 14
2.3. FERRY TERMINAL DEVELOPMENTS BIRKENHEAD ................................................................ ................................ ......... 14
2.4. NETWORK DEVELOPMENT ............................................................................................................................................... 14
2.5. REAL TIME PASSENGER INFORMATION SYSTEMS (RTPIS) ........................................................................................ 15
2.6. ASSET MANAGEMENT ........................................................................................................................................................ 15
3 STRATEGY AND PLANNING ............................................................................................. 16
3.1. STRATEGIC TRANSPORT PLANNING .............................................................................................................................. 16
3.2. PLANNING AND PROGRAMMING ..................................................................................................................................... 16
3.3. WALKING AND CYCLING COORDINATION ................................................................................................................... 18
3.4. REGIONAL ROAD SAFETY COORDINATION .................................................................................................................. 18
4 MARKETING AND COMMUNICATIONS ................................ ............................................ 19
4.1. MARKETING AND CUSTOMER INFORMATION CHANNELS ....................................................................................... 19
4.2. MEDIA AND COMMUNICATIONS – SEPTEMBER 2010 .................................................................................................. 20
5 CORPORATE SERVICE ..................................................................................................... 21
5.1. FINANCIAL REPORT ............................................................................................................................................................ 21
5.2. STATEMENT OF FINANCIAL PERFORMANCE ................................................................................................................ 24
5.3. STATEMENT OF FINANCIAL POSITION ........................................................................................................................... 26

1
SUMMARY
More Aucklanders get on board PT
Public transport use continues to gather speed – with total PT patronage for the month of September
2010 increasing by 7% on the same month last year.
Rail’s popularity continues to grow significantly with patronage increasing by 27.2% in September.
Bus was up by 4.4% while ferry patronage was down slightly by 2.4%.
There has also been a steady increase in total public transport patronage for the 3 months to 30 Sept
with an increase of 6.2% on last year to date. This has seen rail use increase by 18.2%, bus by 4.7%
and ferry down fractionally by 0.4% compared to last year.
The Northern Express continues to show excellent growth with patronage up by 20.2% for the month
of September and by 20.7% compared to the equivalent 3 months to date last year.
Service improvements for our passengers
The recently reopened Onehunga Branch Line has seen strong patronage continue in September with
approximately 500 passengers using the service per day.
ARTA’s pledge to offer free train services on the weekend of 4 and 5 September attracted 25,000
passengers. This was a very successful initiative which helped to reduce the impact of the closure of
the Newmarket motorway viaduct.
Six carriage train services were introduced at peak times on the Western Line in September to
increase capacity and improve services for passengers.
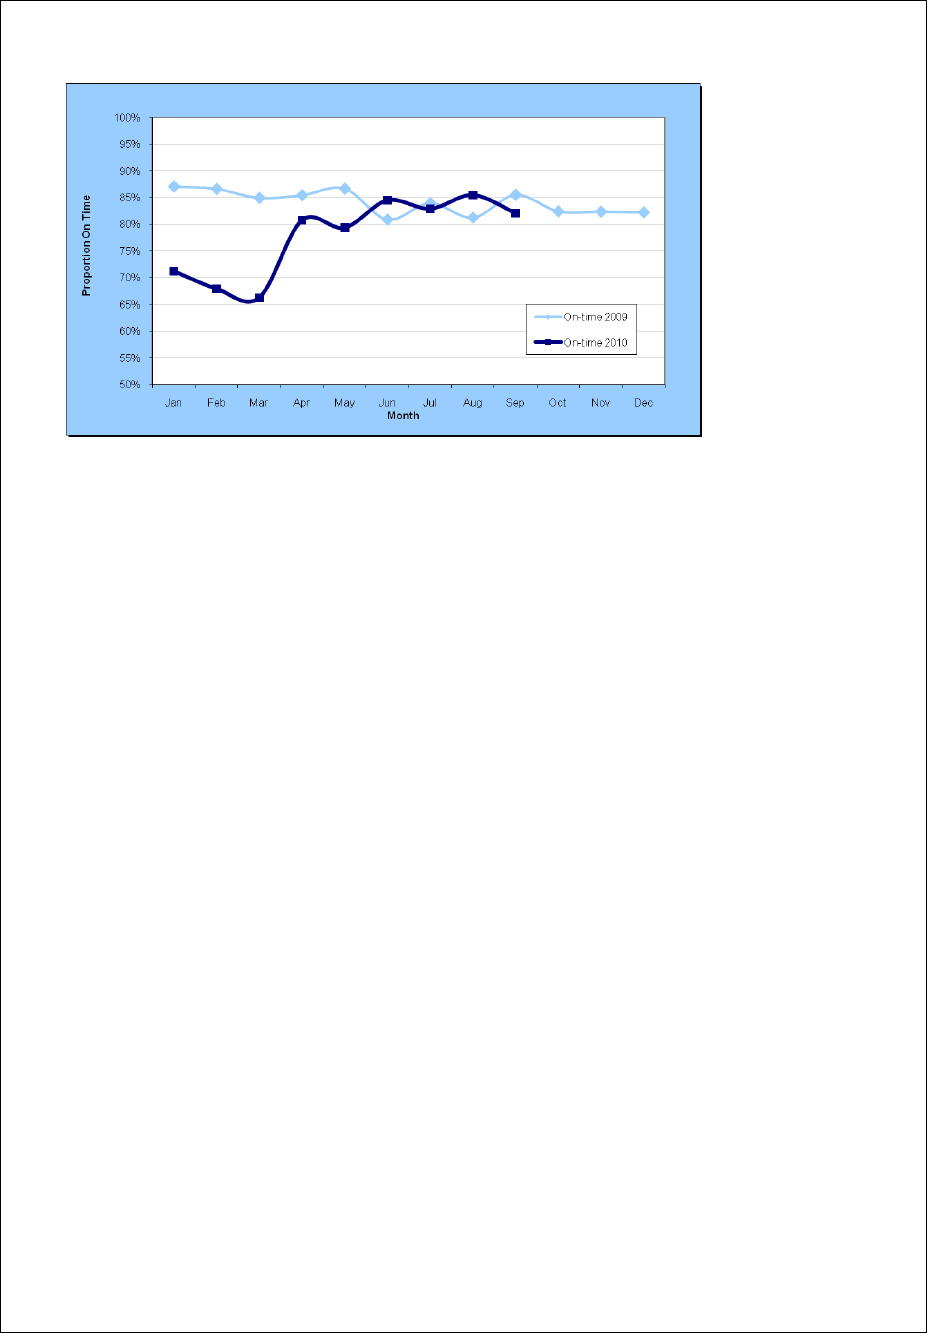
Rail service punctuality for September declined to 82.0% of services on time from 85.4% in August
and 85.5% in September last year, partly due to adverse weather conditions at the end of the month.
Infrastructure developments still coming
The highly anticipated state-of-the-art New Lynn Rail and Bus Interchange was officially opened on 24
September by the Governor General and the Minister of Transport.
The historic Onehunga Branch Line and the new stations at Penrose, Te Papapa and Onehunga were
officially opened on 18 September with passenger services commencing on 19 September.
The station base slab at Manukau Station is now complete and platform construction is continuing.
Development of the stabling facilities at the Tamaki site is underway with the installation of track and
signal components.
The new outer berth at Birkenhead Ferry Terminal will officially open on 8 October.
2
1 CUSTOMER SERVICES
1.1. PASSENGER TRANSPORT PATRONAGE – NETWORK WIDE
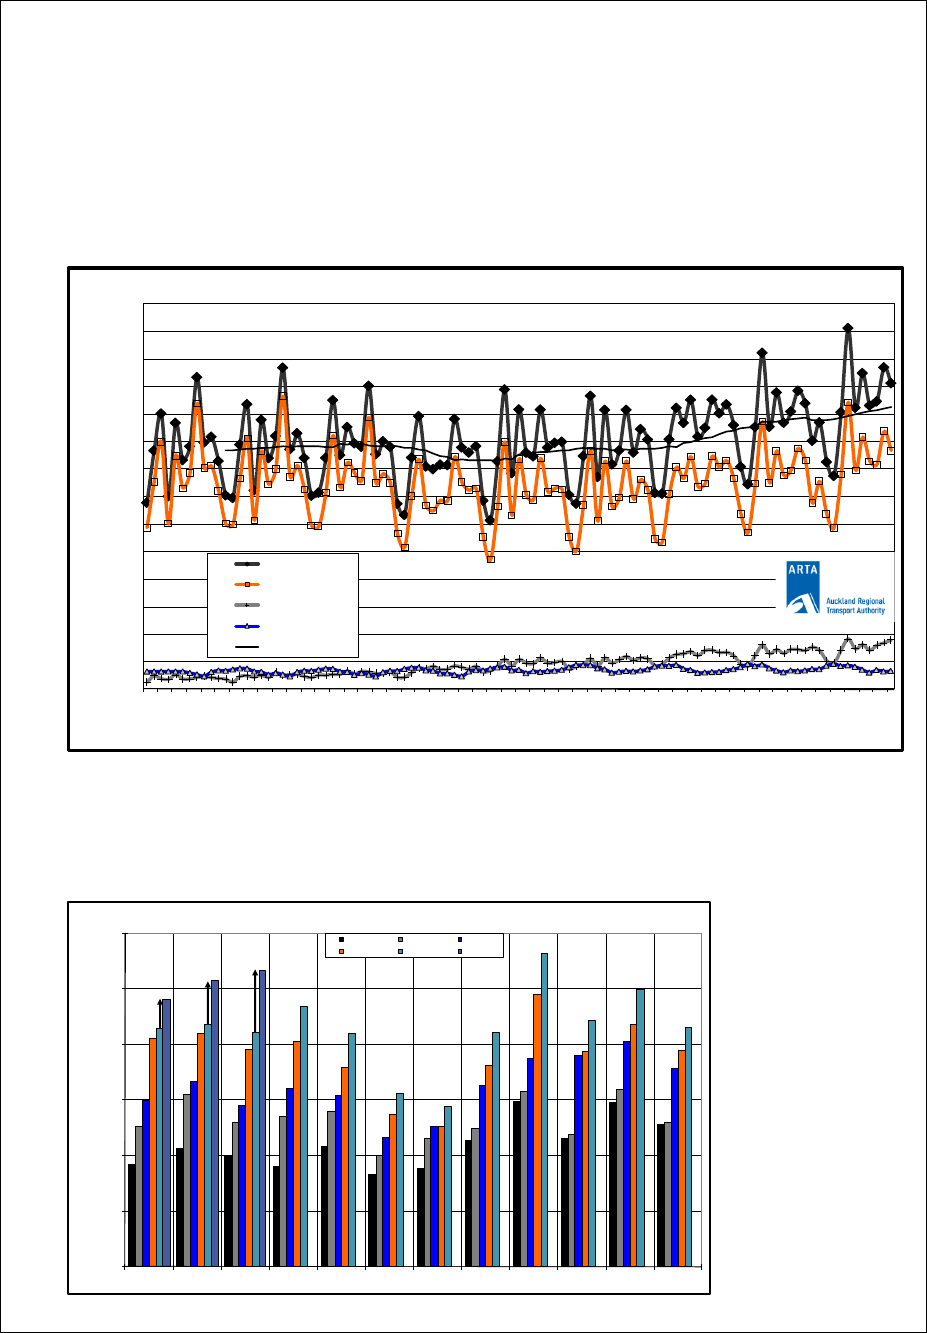
The total combined bus, ferry, and rail patronage for the month of September is 7.0% (366,137
boardings) higher than September 2009 at 5,559,954 boardings. For the financial year to date (3
months) the total cumulative patronage is 6.2% (975,520 boardings) higher than the corresponding
months in the 2009/10 financial year.
-
500,000
1,000,000
1,500,000
2,000,000
2,500,000
3,000,000
3,500,000
4,000,000
4,500,000
5,000,000
5,500,000
6,000,000
6,500,000
7,000,000
Jan-02
Mar-02
May-02
Jul-02
Sep-02
Nov-02
Jan-03
Mar-03
May-03
Jul-03
Sep-03
Nov-03
Jan-04
Mar-04
May-04
Jul-04
Sep-04
Nov-04
Jan-05
Mar-05
May-05
Jul-05
Sep-05
Nov-05
Jan-06
Mar-06
May-06
Jul-06
Sep-06
Nov-06
Jan-07
Mar-07
May-07
Jul-07
Sep-07
Nov-07
Jan-08
Mar-08
May-08
Jul-08
Sep-08
Nov-08
Jan-09
Mar-09
May-09
Jul-09
Sep-09
Nov-09
Jan-10
Mar-10
May-10
Jul-10
Sep-10
Monthly Patronage by mode
Total patronage
Bus
Rail
Ferry
Moving Average
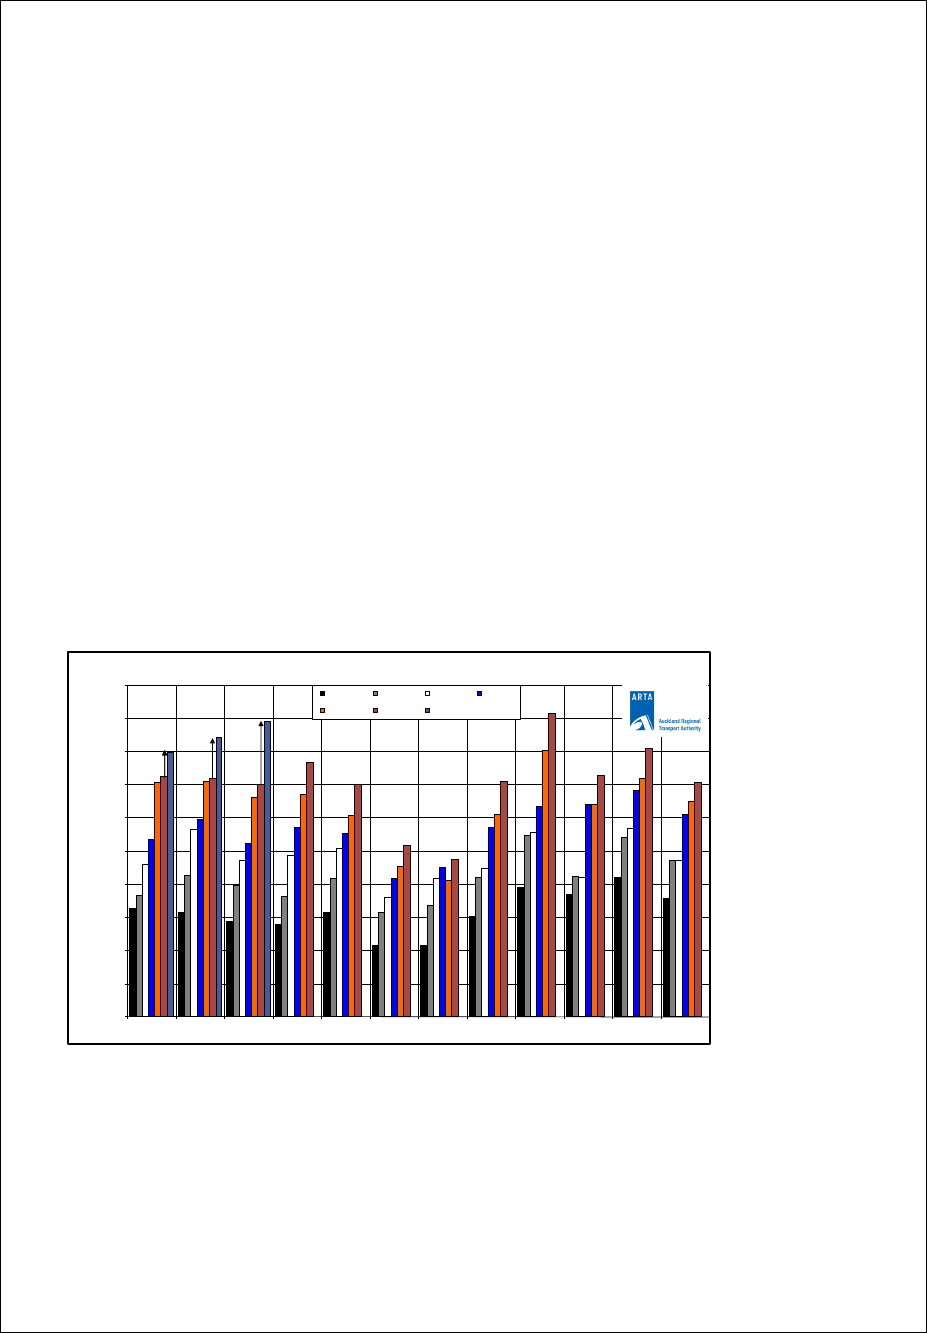
Rapid Transit Network (Rail and Northern Express):
The total RTN patronage for September is 26.0% (219,907 boardings) higher than September 2009.
For the financial year to date RTN patronage is 18.6% (479,159 boardings) higher than the
corresponding months in the 2009/10 financial year.
-
200,000
400,000
600,000
800,000
1,000,000
1,200,000
Jul
Aug
Sep
Oct
Nov
Dec
Jan
Feb
Mar
Apr
May
Jun
Rapid Transit Network (RTN) Monthly Patronage
2005/06
2006/07
2007/08
2008/09
2009/10
2010/11
12.1%
17.8%
26.0%
3
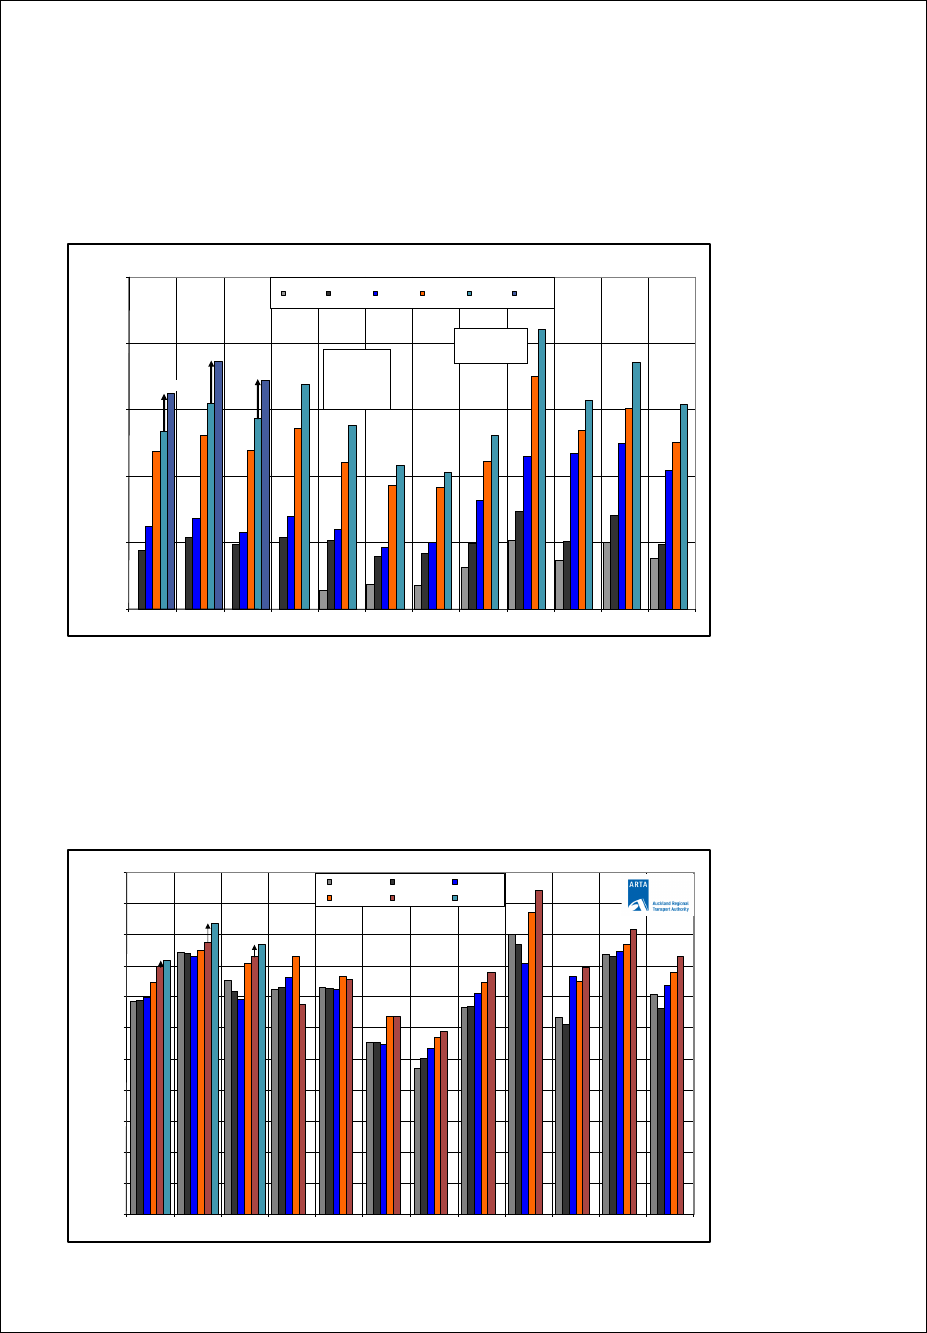
The Northern Express patronage grew by 20.2% or 29,070 boardings for September 2010 compared
to September 2009 and for the financial year to date is up by 20.7% (89,442 boardings) compared to
the corresponding three months in the last financial year.
There has been 1.88 million passengers recorded using the Northern Express over the last twelve
months, an increase of 20.3% on the same period last year.
-
50,000
100,000
150,000
200,000
250,000
July
August
September
October
November
December
January
February
March
April
May
June
Northern Express Patronage
2005/06
2006/07
2007/08
2008/09
2009/10
2010/11
Full busway
Opens
February 2008
November
2005
Constellation
and Albany
stations open
21.2%
20.6%
20.2%
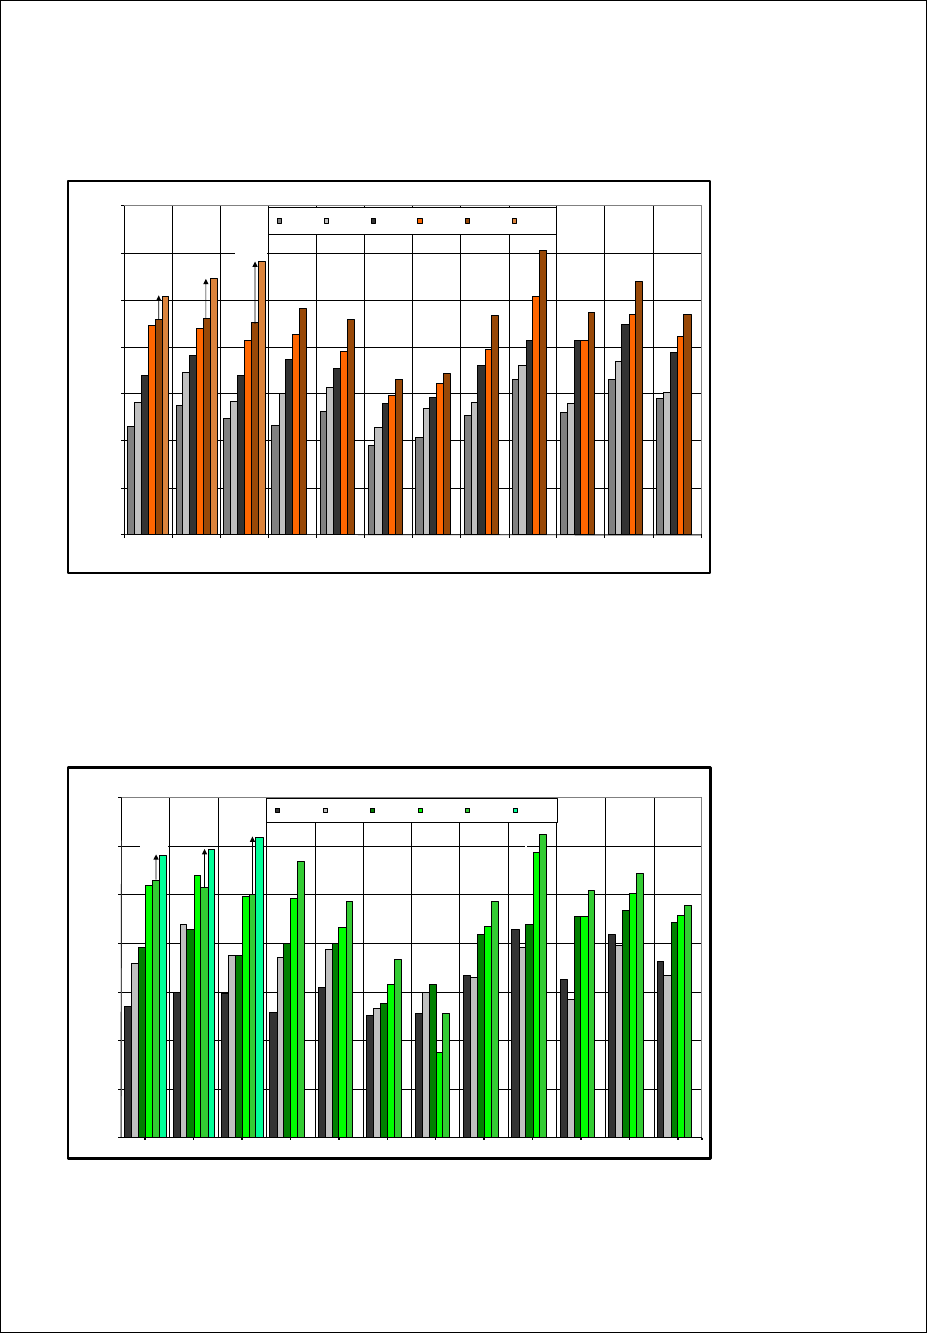
Bus Patronage
Bus patronage grew by 4.4% (183,500 boardings) compared to last September. For the financial year
to date, bus patronage is up 4.7% (589,911 boardings) compared to the same three months of the
2009/10 financial year.
-
500,000
1,000,000
1,500,000
2,000,000
2,500,000
3,000,000
3,500,000
4,000,000
4,500,000
5,000,000
5,500,000
July
August
September
October
November
December
January
February
March
April
May
June
Bus patronage by month
2005/06
2006/07
2007/08
2008/09
2009/10
2010/11
2.5%
7.0%
4.4%
4
Rail Patronage
There was a significant surge in patronage during September despite some performance issues.
Several factors influenced the increase in passenger journeys in the month:
A new timetable was introduced on 19 September that provided a 25% increase in the number of
services operated per week and re-introduced regular passenger services on the Onehunga
Branch Line. Initial reports indicate that the new stations of Onehunga and Te Papapa are being
used by about 500 passengers per day. The timetable also introduced six-car trains on some
services on the Western Line.
Free travel was offered on train services from 5pm Saturday 4 September and all day Sunday 5
September when the southbound lanes of the southern motorway were closed to realign the road
to the newly completely section of the Newmarket viaduct. There were just over 25,000
passengers recorded on the free trains, and more than 35,000 on all trains during the weekend
compared to an average of approximately 15,000 over the two days of a normal weekend. More
than 20,000 passengers took the opportunity to travel by train on the Sunday. Additional trains
were scheduled on all lines to manage the demand.
Including the counts made of the number of passengers boarding the free trains on 4th and 5th
September and the advance purchases made towards the end of the month there were 893,000
passengers recording during the month which is 27.2% more than the same month last year. For the
year to date there have been 2.535 million passengers recorded travelling by rail an increase of
18.2% on the same period last year.
For the rolling twelve months October 2009 to September 2010 the total number of passengers
recorded travelling by rail was 8.869 million, an increase of 14.9% on the equivalent period last year.
-
100,000
200,000
300,000
400,000
500,000
600,000
700,000
800,000
900,000
1,000,000
July
August
September
October
November
December
January
February
March
April
May
June
Rail monthly patronage
2004/05
2005/06
2006/07
2007/08
2008/09
2009/10
2010/11
10.4%
17.2%
27.2%
There were 556,000 passenger journeys recorded on Southern and Eastern Line trains during
September, an increase of 23.3% on the same month last year. For the financial year to date there
have been 1.610 million passengers recorded using Southern and Eastern Line trains, 17.4% more
than the same quarter last year. For the rolling twelve month period October to September, there
have been 5.784 million passengers recorded on Southern and Eastern Line services, 15.3% more
than last year.
5
The Onehunga Line recorded 27,000 passengers in the period 19 to 30 September. Included in this
number is the patronage carried on Onehunga Line services to and from the Southern Line stations of
Ellerslie, Greenlane, Remuera and Newmarket. The introduction of the new services has increased
travel options for commuters wishing to travel to or from these stations
-
100,000
200,000
300,000
400,000
500,000
600,000
700,000
Jul
Aug
Sep
Oct
Nov
Dec
Jan
Feb
Mar
Apr
May
Jun
Southern & Eastern Lines (Including Onehunga)
2005/06
2006/07
2007/08
2008/09
2009/10
2010/11
10.7%
18.3%
29.3%
In September there were 310,000 passengers recorded on Western Line trains, an increase of 23.4%
on the same month last year. For the financial year to date there have been 898,000 passengers
recorded on Western Line trains which is a 16.0% increase on the same quarter last year, while for
the rolling twelve month period 3.057 million passengers have travelled on Western Line trains, 13.1%
more than the same twelve month period last year.
-
50,000
100,000
150,000
200,000
250,000
300,000
350,000
Jul
Aug
Sep
Oct
Nov
Dec
Jan
Feb
Mar
Apr
May
Jun
Western line
2005/06
2006/07
2007/08
2008/09
2009/10
2010/11
9.9%
15.1%
23.4%
6
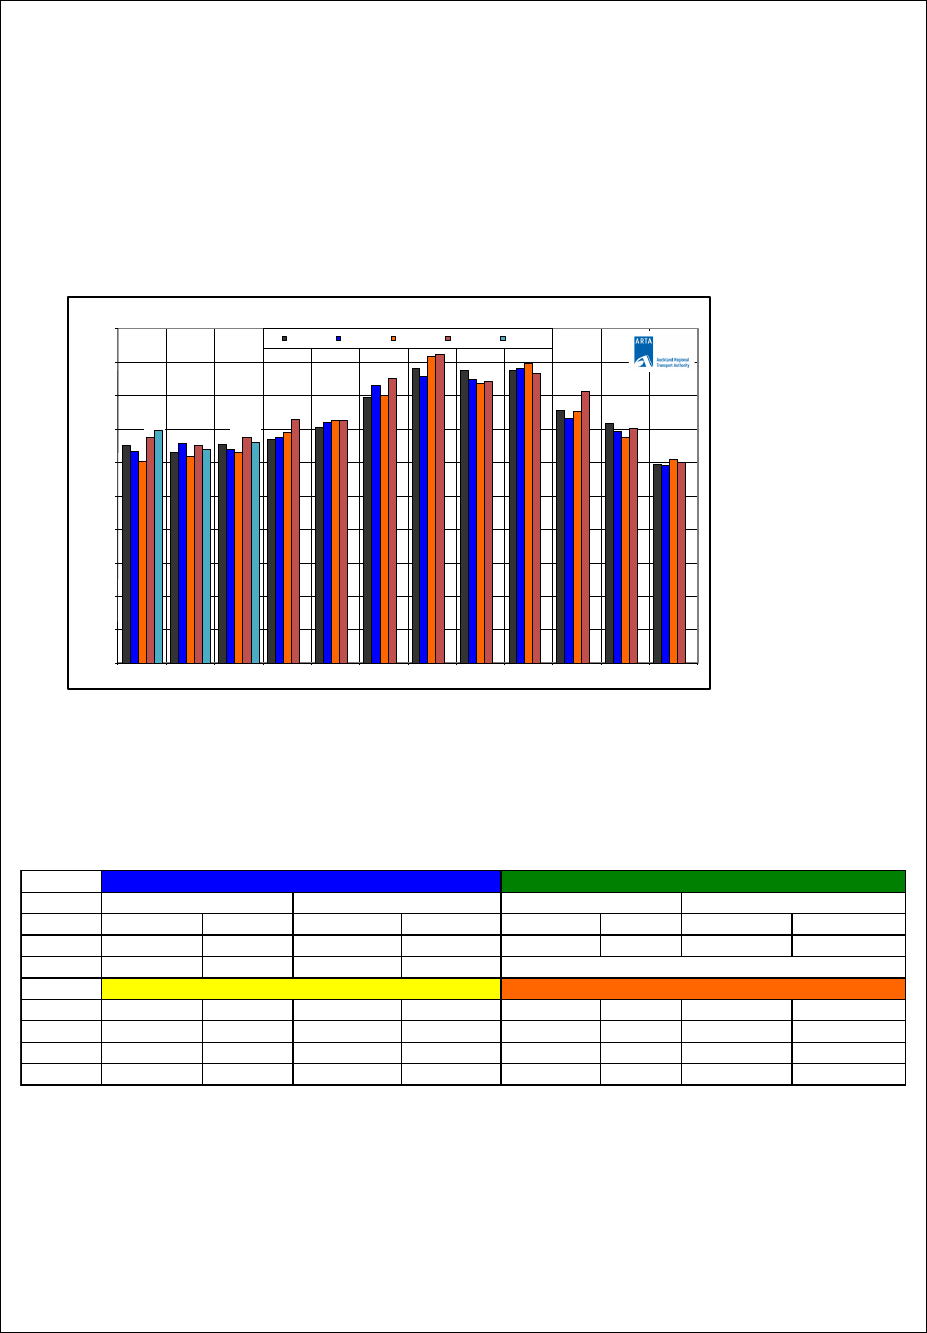
Ferry Patronage
Ferry patronage for September is -2.4% (8,199 boardings) lower than last September, for the financial
year to date patronage is down by -0.4% (4,106 boardings) compared to the same period in the
2009/10 financial year.
In September 2009 a promotion was run whereby a number of ferries offered free travel, resulting in a
patronage increase of 7.6% for that month. Although ferry patronage this September is down on the
September 2009, it has increased by 5.1% over the last two years compared to September 2008.
-
50,000
100,000
150,000
200,000
250,000
300,000
350,000
400,000
450,000
500,000
July
August
September
October
November
December
January
February
March
April
May
June
Ferry patronage monthly comparisons
2006/07
2007/08
2008/09
2009/10
2010/11
2.7%
-1.3%
-2.4%
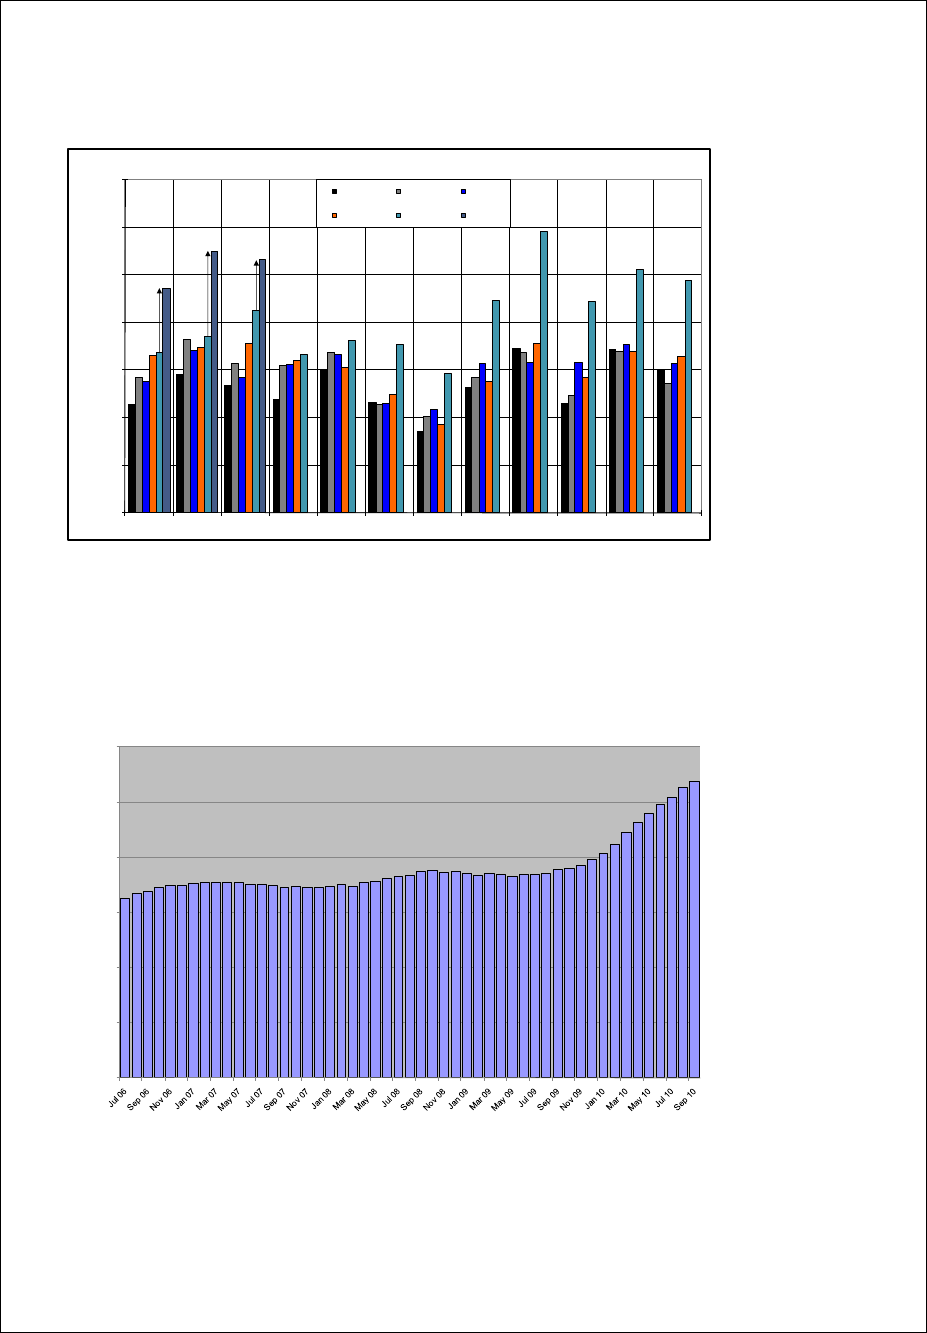
Patronage Analysis
Growth in the bus sector has been seen primarily in the North and South of Auckland. These are
areas where services have been redesigned over the last two to three years with simpler and higher
frequency services.
Jul 24,281 3.1% 24,281 3.1% 3,829 1.0% 3,829 1.0%
Aug 70,930 8.0% 95,210 5.7% 16,405 3.9% 20,235 2.5%
Sep 50,372 6.1% 145,582 5.8%
By Month Cumulative By Month Cumulative
Jul 54,543 7.2% 54,543 7.2% 6,741- -0.4% 6,741- -0.4%
Aug 97,083 11.1% 151,625 9.3% 92,758 4.5% 86,017 2.2%
Sep 39,699 4.7% 191,325 7.7% 86,147 4.5% 172,165 2.9%
South Sector
Isthmus Sector
North Sector (excluding Northern Express)
West Sector
By Month
Cumulative
By Month
Cumulative
Ritchies data unavailable at time of writing
7
-
20,000
40,000
60,000
80,000
100,000
120,000
140,000
July
August
September
October
November
December
January
February
March
April
May
June
Botany Local, Manukau Crosstown and Pakuranga/Airport Monthly Patronage
2005/06
2006/07
2007/08
2008/09
2009/10
2010/11
39.9%
47.9%
25.0%
Patronage on this group of routes is now exceding 1 million per year
0
200,000
400,000
600,000
800,000
1,000,000
1,200,000
Cumulative Botany Local, Manukau Crosstown and Pakuranga/Airport 12 Month Rolling Total
1,074,915

8
PT Service Punctuality and Reliability
Rail Service
September was a challenging month for rail service performance. The normal “teething” issues
associated with the implementation of a new timetable that represented a 25% increase in service
levels, and included the introduction of six-car trains on the Western Line, coincided with a period of
extreme weather conditions which saw a decline in service performance in the latter part of the
month. In September 82.0% of services operated on time or within five minutes of their schedule
during the month compared to 85.4% in August and 85.5% for the same month last year.
The newly introduced Onehunga services recorded the best performance of the service groupings in
September with 88.1% of services arriving within 5 minutes of their scheduled time. Trains on the line
were subject to speed restrictions during the first week of operation as a precautionary measure given
the number of level crossings on the line and while the signals were still subject to testing.
Services on the Western Line services recorded a slight decline on recent results with 85.5% of
services operating on time or within five minutes of schedule in September. This compares to 88.4%
last month and 88.4% in the same month last year.
Southern and Eastern Line trains continued to be impacted to a greater extent by the major incidents
(detailed below) and the network upgrade works than were the services on the Western Line. For the
month 79.4% of Southern and Eastern Line services operated on time or within five minutes of their
schedule which is a reduction on the 83.9% recorded last month and 84.0% for the same month last
year.
The following major incidents were reported during the month:
Signal, points and track failures – During the evening peak of 3 September a fault with a computer
that controls the signals at Britomart resulted in delays to services operating on all lines.
Train faults – Two train faults occurred during the month that resulted in the train being disabled at
critical points on the network causing extensive delays to services. The first occurred at Sturges
Road during the morning peak of 22 September. All services were terminated at Henderson until
the train could be recovered and bus replacements were arranged between Waitakere and
Henderson. Shortly before midday on 29 September a train was disabled at Middlemore which
led to extensive delays to services on the Southern and Eastern Lines, with consequential impacts
on the Western and Onehunga Lines, which continued through to the evening peak.
Operations – The free travel offered on 5 September resulted in a large number of people
travelling by train, including family groups with small children, and this increased the time the
trains were stopped at stations to ensure that all passengers had the opportunity to board and
alight safely. As a result delays accrued to services on all lines.
Other – Precautionary speed restrictions were imposed across the network on two occasions
during a week of extreme weather conditions when there was a risk of the strong winds blowing
debris across the rail corridor into the path of a train. These conditions caused part of the roof of
the Lion Breweries building in Khyber Pass to lift which then landed by the tracks, narrowly
avoiding a train. Speed restrictions were in place from the evening of 17 September through to
the morning of 18 September and again from mid-morning through to the early evening of 22
September and these measures caused significant disruptions to planned services on all lines.
9
Rail Punctuality: Services Operating On-time or Within Five Minutes (All Lines)
The reliability of train services, or the proportion of services that reached their scheduled destination
and were not cancelled, was 98.1% for September, a reduction on the 98.5% for August and 98.6%
for the same month last year. Faulty trains accounted for just under 70% of total cancellations with
the two incidents detailed above accounting for 42% of these cancellations. Services on the Western
Line were most affected by these cancellations with 97.1% of services reaching their scheduled
destination compared to 98.7% of Southern and Eastern Line services and 97.7% of Onehunga
services.
Services on the Western Line were replaced by buses over the weekend of 25 and 26 September to
progress track and signal works at Morningside and Kingsland and to upgrade level crossings
between Avondale and Morningside.
Passenger Delay Minutes
While passenger delay minutes increased by 48.3% to 15,682 minutes in September this needs to be
put in context of a 25% increase in service levels from 19 September and the week of extreme
weather conditions. While the result is a reversal of recent trends the majority (60%) of the increased
delay minutes were the result of the precautionary speed restrictions that were in place due to the
weather conditions. Delays resulting from operations also increased mainly as a result of teething
issues associated with the new timetable. There was a further 5% reduction in the delay minutes due
to network faults however the two major train faults contributed to a nearly 40% increase in delay
minutes attributed to mechanical maintenance.