Fillable Printable Scientific Poster Template - University of the District of Columbia
Fillable Printable Scientific Poster Template - University of the District of Columbia
Scientific Poster Template - University of the District of Columbia
Copy right:Must ask the author to use this template
Tolessa Deksissa (tdeksissa@udc.edu), July 31, 2008
www.udc.edu/wrri
OBJECTIVE
The current method of flow estimation mainly uses the ground flow equation, which is
a partial differential equation. Software systems such as MODFLOW can only solve
2D equations and pass the data vertically to form a 3D volume. Research on the 3D
models of groundwater flow has fundamental and practical importance to
hydrogeology.
The objective of this study is to establish a 3D model using discrete mathematics,
especially graphical and graph-theoretical methods, to compute groundwater flow.
MATERIAL AND METHOD
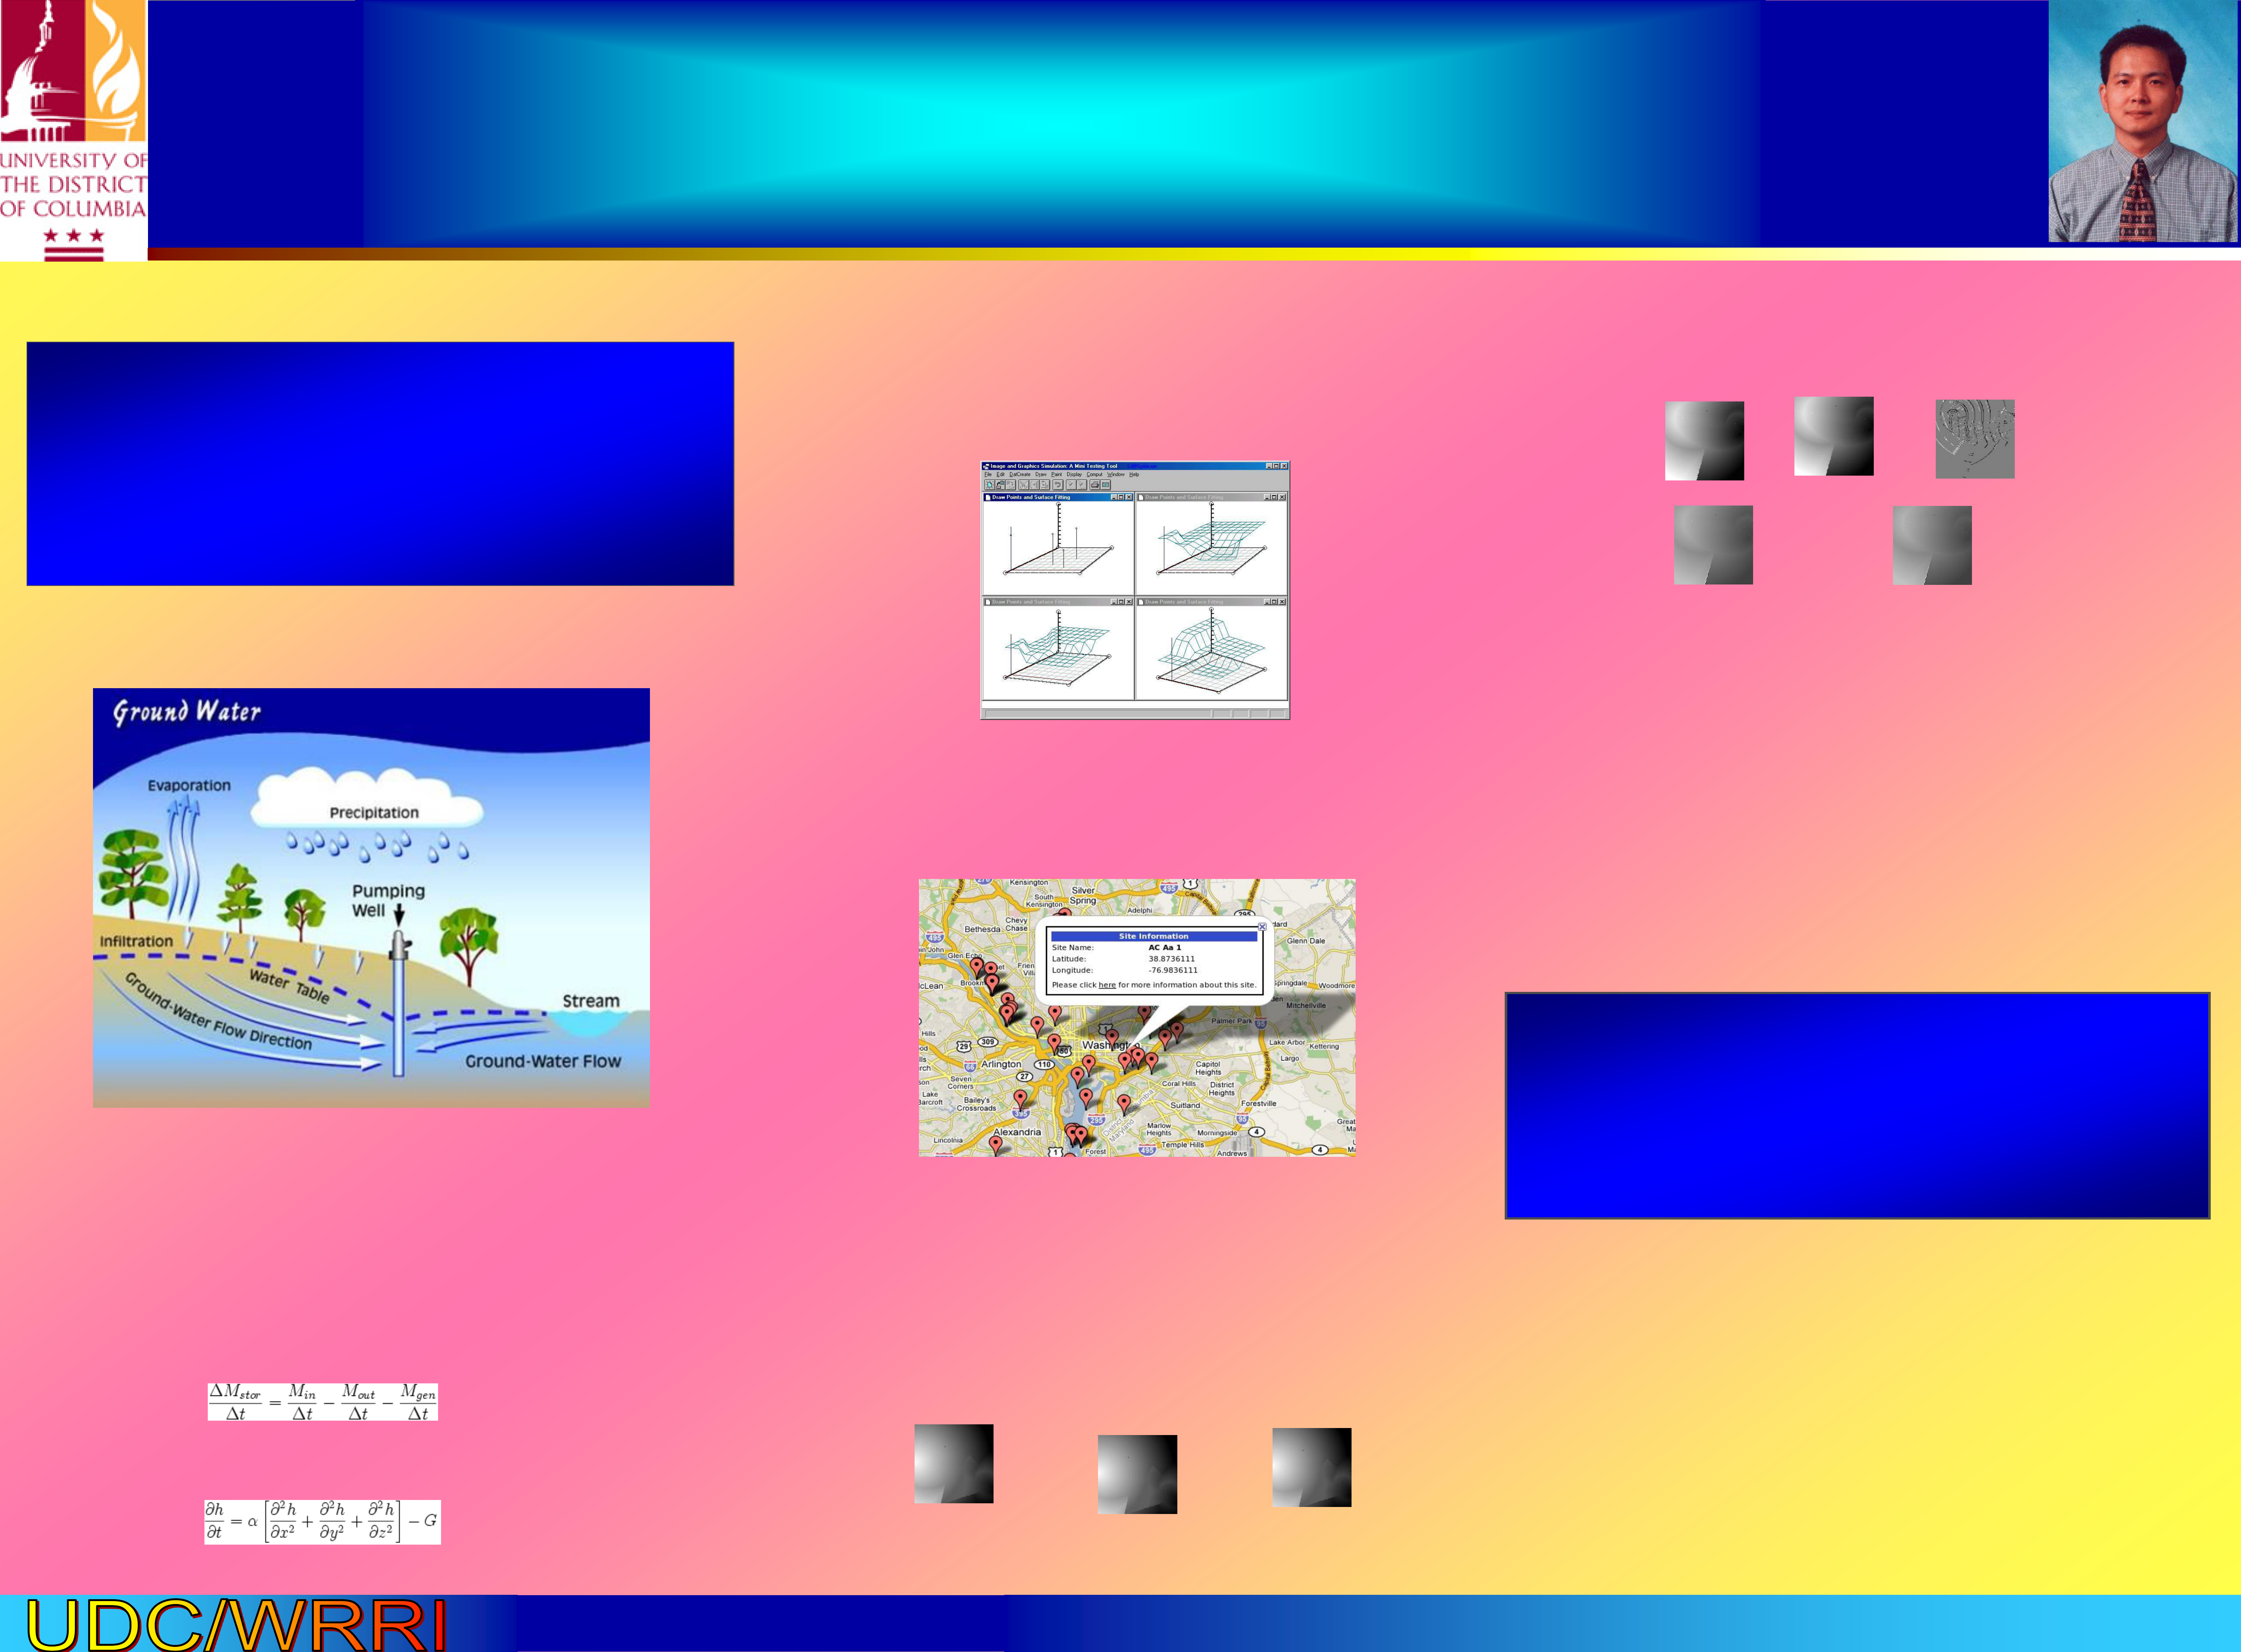
Schematic representation of ground water (www.norcalblogs.com):
Model Formulation:
The groundwater flow equation based on Darcy’s Law usually describes the
movement of groundwater in a porous medium such as aquifers. It is known in
mathematics as the diffusion equation. It is based on the following equations:
Conservation of mass:
DISCUSSION
The proposed application deals specifically with water quality data in the metropolitan
Washington, D.C. area, as reported by the U.S. Geological Survey (USGS). Interested
individuals will access the web-based utility and, from there, easily navigate to the
desired information. The data is presented initially by icons, representing water quality
testing locations, plotted onto a map of the metropolitan Washington, D.C. region; as
the user clicks an icon, he or she will be presented with a list of dates, with each date
corresponding to an actual water quality test. By clicking on a date, users will then be
presented with a page-by-page view of the values for each type of test performed at
that time (e.g. lead, arsenic, etc.). In addition to the ability to browse these sites
randomly, users may enter an address, and a radius, to find only the sites of closest
geographical interest.
Li Chen
Department of Computer Science, University of the District of Columbia, 4200 Connecticut Avenue NW, Washington DC 20008, E-mail: [email protected]
LITERATURE CITED
L. Chen, The necessary and sufficient condition and the efficient algorithms for gradually varied fill,
Chinese Science Bulletin, 35:10(1990).
L. Chen and O. Adjei, lambda-Connected Segmentation and Fitting, Proc. IEEE Conf on System, Man
and Cybernetics 2004, 2004.
L. Chen, Discrete Surfaces and Manifolds: A theory of digital-discrete geometry and topology, SP
Computing, 2004.
Gradual Variation Analysis for Groundwater
Flow in the District of Columbia
ACKNOWLEDGEMENTS
The author expresses thanks to the DC Water Resources Research Institute for financial assistance and
Mr. Travis Branham, a CS student at UDC, prepared the input data.
TAKE HOME MESSAGE
------------------------------------ --------------------------------------------------------------------------------------------------------------
------------------------------------ ----------------------------------------
The results show the usefulness of the proposed method for managing ground water
quality assessment in the District of Columbia.
Further research to ensure the accuracy of the calculation is required and we will add
the finite element method to this project. We also want to use MODEFLOW to
calculate local and small-region flow and to use gradual variation to compute regional
or global data.
Differential form:
Approach to solve those equations
Discrete surface reconstruction :
Real Data Processing and Application
These results use an algorithm to fit the initial data set using an individualized fit.
This algorithm is also made by the rough graduate varied surface fitting by scanning
through the fitting array. There are many clear boundary lines in the images. In order
to reduce error, our new algorithm will use more accurate formulas to calculate the
derivatives.
(a) day 1 (b) day 50 (c) day 100
(a)day1 (b) day 2 (c) enhanced difference
(d) Day 2 with flow equation (d) Day 3 with flow equation
iteration iteration
Northern VA Groundwater distribution calculated by gradually varied surfaces and the flow
equation:
Northern VA Groundwater distribution calculated by gradually varied surfaces date from
04/01/07. The intensity indicated the depth of the groundwater:
RESULTS
Data Preparation
A web-based application for geographically plotting the water quality data in the District of
Columbia was developed: