Fillable Printable Template for Scientific Poster
Fillable Printable Template for Scientific Poster
Template for Scientific Poster
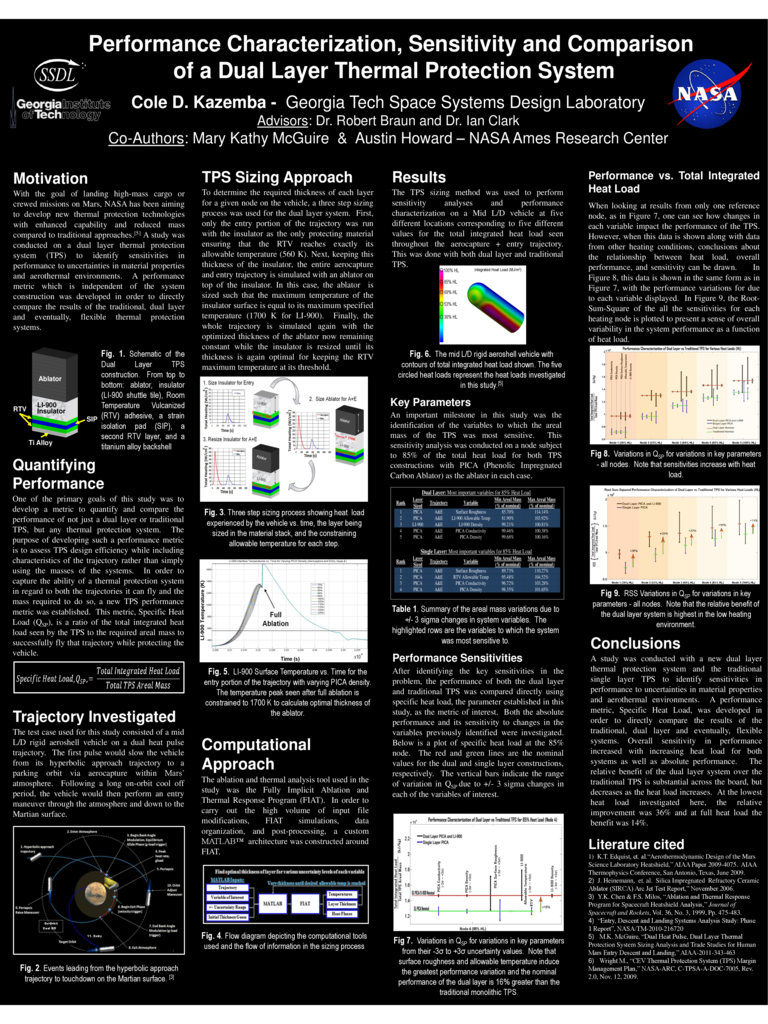
Motivation
With the goal of landing high-mass cargo or
crewed missions on Mars, NASA has been aiming
to develop new thermal protection technologies
with enhanced capability and reduced mass
compared to traditional approaches.
[5]
A study was
conducted on a dual layer thermal protection
system (TPS) to identify sensitivities in
performance to uncertainties in material properties
and aerothermal environments. A performance
metric which is independent of the system
construction was developed in order to directly
compare the results of the traditional, dual layer
and eventually, flexible thermal protection
systems.
Quantifying
Performance
One of the primary goals of this study was to
develop a metric to quantify and compare the
performance of not just a dual layer or traditional
TPS, but any thermal protection system. The
purpose of developing such a performance metric
is to assess TPS design efficiency while including
characteristics of the trajectory rather than simply
using the masses of the systems. In order to
capture the ability of a thermal protection system
in regard to both the trajectories it can fly and the
mass required to do so, a new TPS performance
metric was established. This metric, Specific Heat
Load (Q
SP
), is a ratio of the total integrated heat
load seen by the TPS to the required areal mass to
successfully fly that trajectory while protecting the
vehicle.
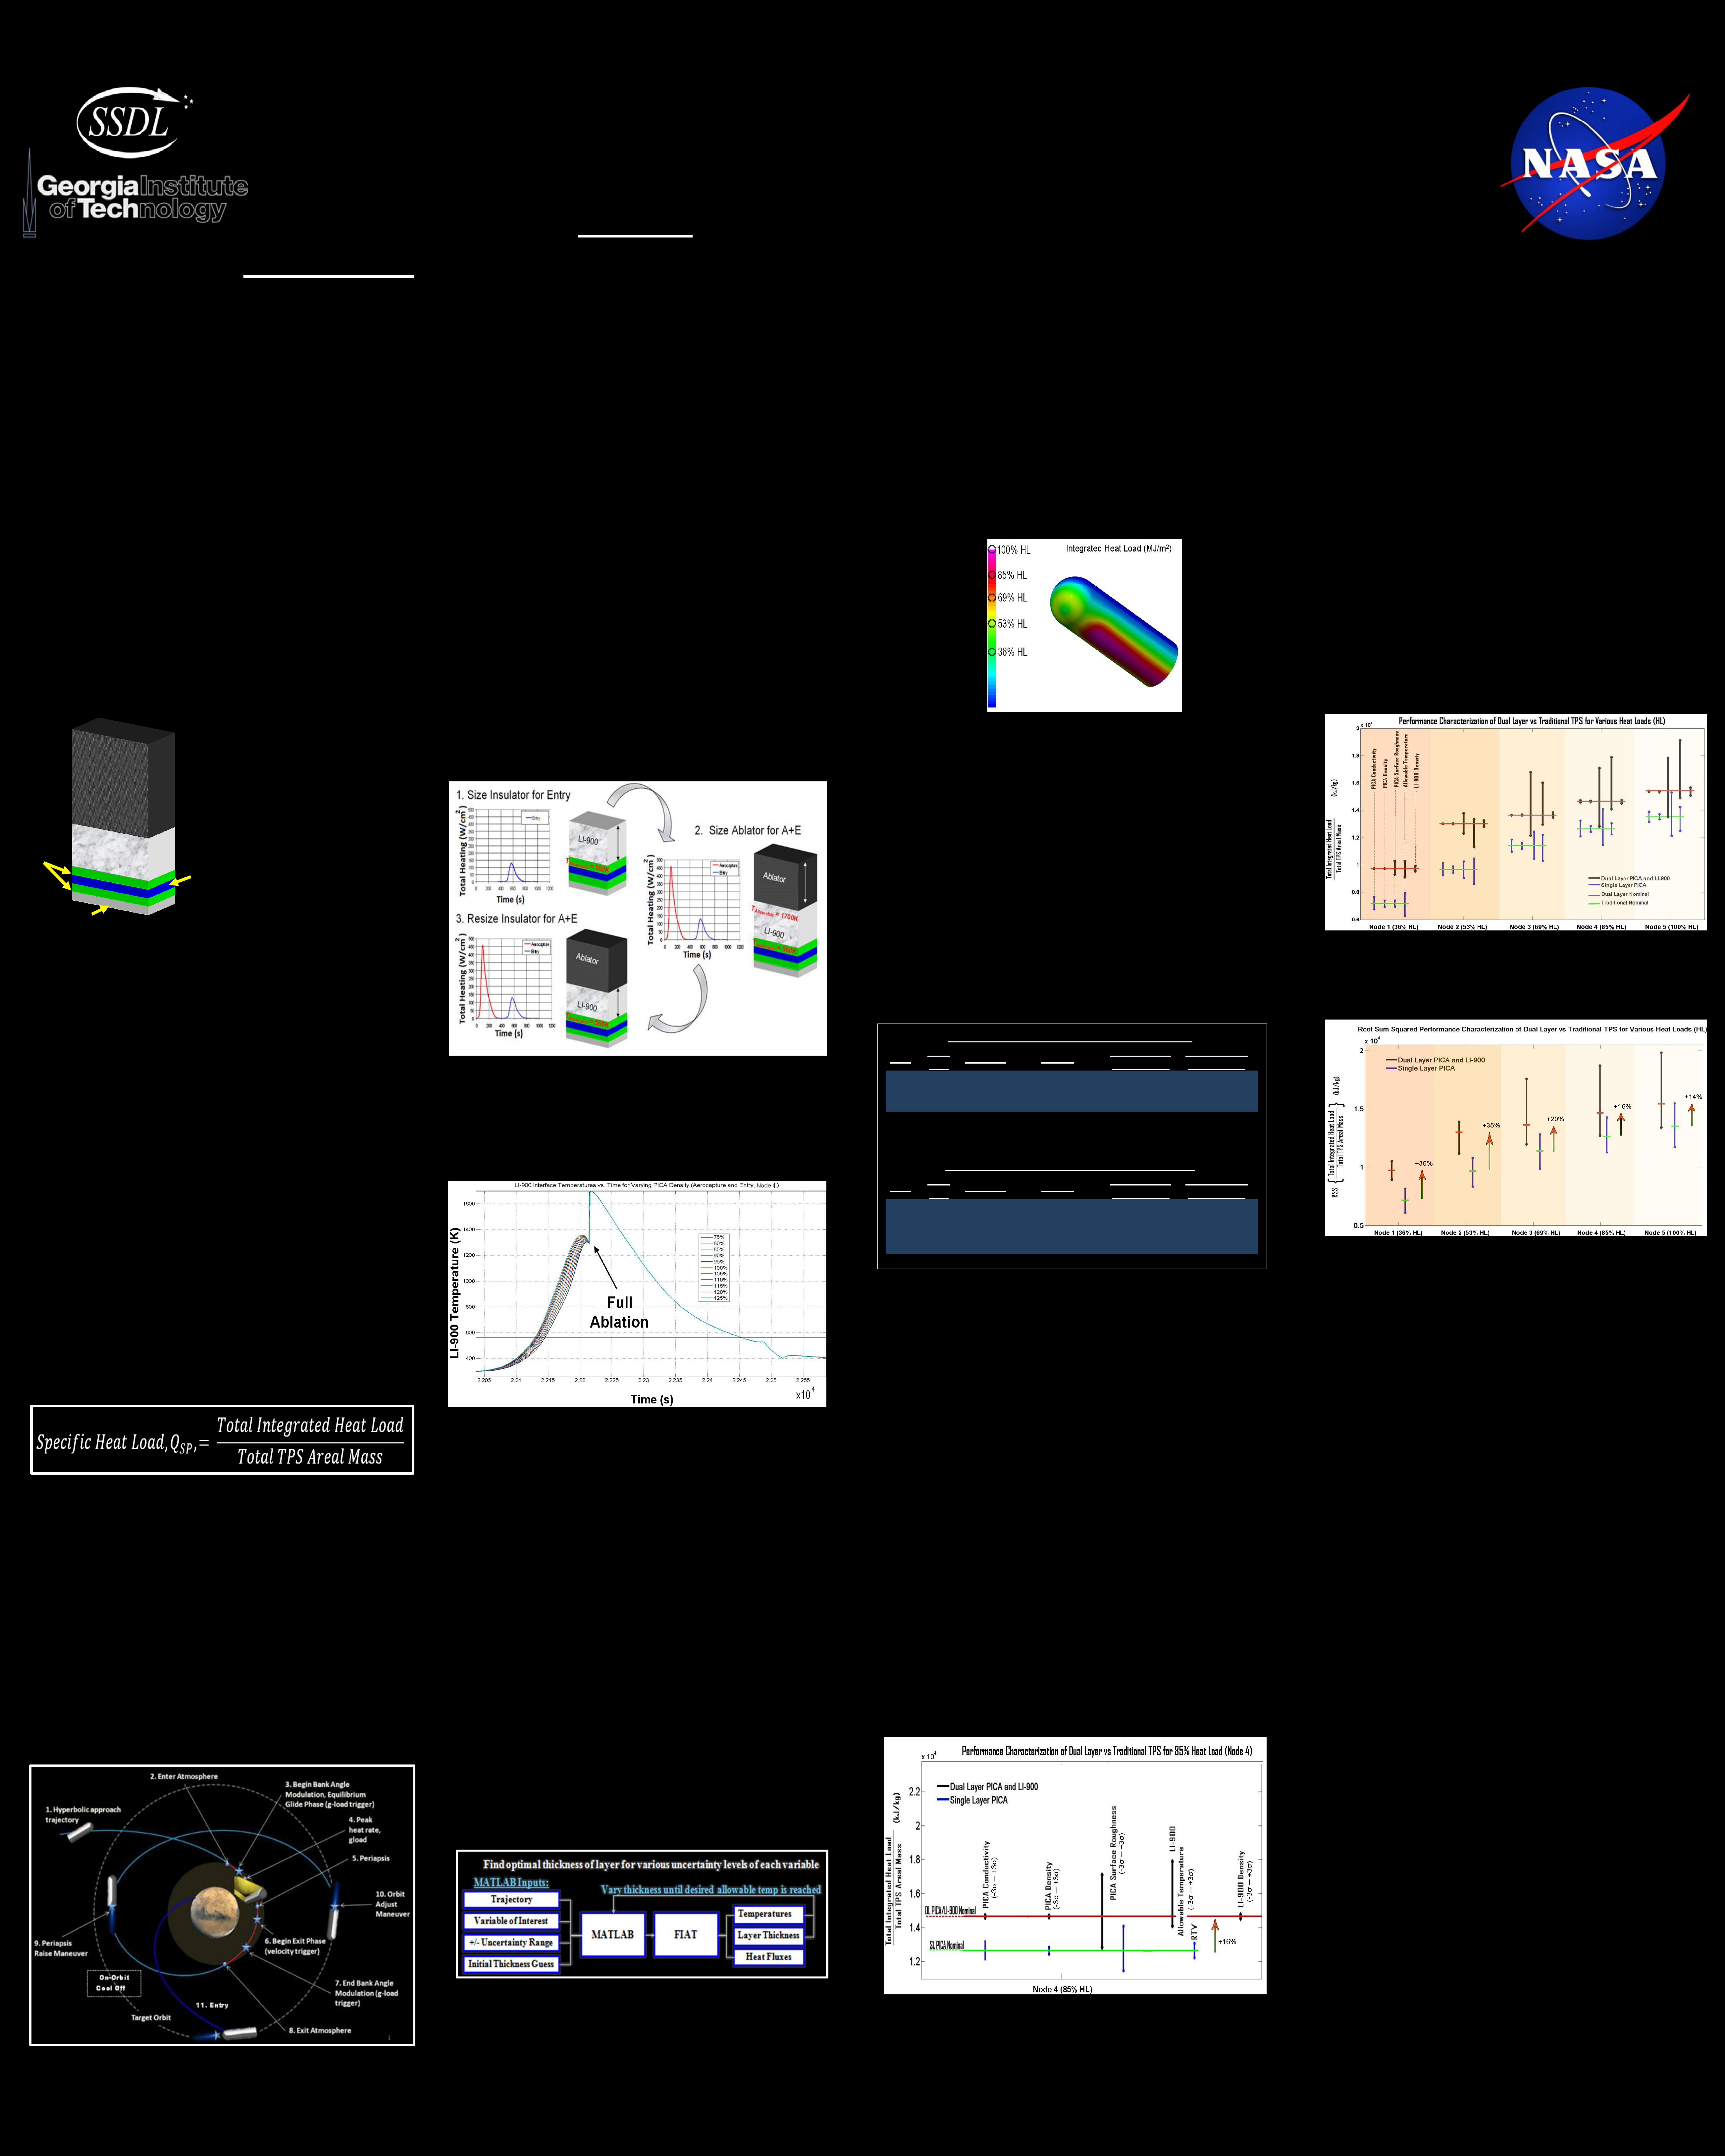
Performance vs. Total Integrated
Heat Load
When looking at results from only one reference
node, as in Figure 7, one can see how changes in
each variable impact the performance of the TPS.
However, when this data is shown along with data
from other heating conditions, conclusions about
the relationship between heat load, overall
performance, and sensitivity can be drawn. In
Figure 8, this data is shown in the same form as in
Figure 7, with the performance variations for due
to each variable displayed. In Figure 9, the Root-
Sum-Square of the all the sensitivities for each
heating node is plotted to present a sense of overall
variability in the system performance as a function
of heat load.
Performance Characterization, Sensitivity and Comparison
of a Dual Layer Thermal Protection System
Literature cited
1) K.T. Edquist, et. al.“Aerothermodynamic Design of the Mars
Science Laboratory Heatshield,” AIAA Paper 2009-4075. AIAA
Thermophysics Conference, San Antonio, Texas, June 2009.
2) J. Heinemann, et. al. Silica Impregnated Refractory Ceramic
Ablator (SIRCA) Arc Jet Test Report,” November 2006.
3) Y.K. Chen & F.S. Milos, “Ablation and Thermal Response
Program for Spacecraft Heatshield Analysis,” Journal of
Spacecraft and Rockets, Vol. 36, No. 3, 1999, Pp. 475-483.
4) “Entry, Descent and Landing Systems Analysis Study: Phase
1 Report”, NASA/TM-2010-216720
5) M.K. McGuire, “Dual Heat Pulse, Dual Layer Thermal
Protection System Sizing Analysis and Trade Studies for Human
Mars Entry Descent and Landing,” AIAA-2011-343-463
6) Wright M., “CEV Thermal Protection System (TPS) Margin
Management Plan,” NASA-ARC, C-TPSA-A-DOC-7005, Rev.
2.0, Nov. 12, 2009.
Fig. 1. Schematic of the
Dual Layer TPS
construction. From top to
bottom: ablator, insulator
(LI-900 shuttle tile), Room
Temperature Vulcanized
(RTV) adhesive, a strain
isolation pad (SIP), a
second RTV layer, and a
titanium alloy backshell
Ablator
LI-900
Insulator
RTV
SIP
Ti Alloy
Fig. 3. Three step sizing process showing heat load
experienced by the vehicle vs. time, the layer being
sized in the material stack, and the constraining
allowable temperature for each step.
TPS Sizing Approach
To determine the required thickness of each layer
for a given node on the vehicle, a three step sizing
process was used for the dual layer system. First,
only the entry portion of the trajectory was run
with the insulator as the only protecting material
ensuring that the RTV reaches exactly its
allowable temperature (560 K). Next, keeping this
thickness of the insulator, the entire aerocapture
and entry trajectory is simulated with an ablator on
top of the insulator. In this case, the ablator is
sized such that the maximum temperature of the
insulator surface is equal to its maximum specified
temperature (1700 K for LI-900). Finally, the
whole trajectory is simulated again with the
optimized thickness of the ablator now remaining
constant while the insulator is resized until its
thickness is again optimal for keeping the RTV
maximum temperature at its threshold.
Trajectory Investigated
The test case used for this study consisted of a mid
L/D rigid aeroshell vehicle on a dual heat pulse
trajectory. The first pulse would slow the vehicle
from its hyperbolic approach trajectory to a
parking orbit via aerocapture within Mars’
atmosphere. Following a long on-orbit cool off
period, the vehicle would then perform an entry
maneuver through the atmosphere and down to the
Martian surface.
Fig. 2. Events leading from the hyperbolic approach
trajectory to touchdown on the Martian surface.
[3]
Fig. 4. Flow diagram depicting the computational tools
used and the flow of information in the sizing process
Computational
Approach
The ablation and thermal analysis tool used in the
study was the Fully Implicit Ablation and
Thermal Response Program (FIAT). In order to
carry out the high volume of input file
modifications, FIAT simulations, data
organization, and post-processing, a custom
MATLAB™ architecture was constructed around
FIAT.
Fig. 5. LI-900 Surface Temperature vs. Time for the
entry portion of the trajectory with varying PICA density.
The temperature peak seen after full ablation is
constrained to 1700 K to calculate optimal thickness of
the ablator.
Table 1. Summary of the areal mass variations due to
+/- 3 sigma changes in system variables. The
highlighted rows are the variables to which the system
was most sensitive to.
Results
The TPS sizing method was used to perform
sensitivity analyses and performance
characterization on a Mid L/D vehicle at five
different locations corresponding to five different
values for the total integrated heat load seen
throughout the aerocapture + entry trajectory.
This was done with both dual layer and traditional
TPS.
Fig. 6. The mid L/D rigid aeroshell vehicle with
contours of total integrated heat load shown. The five
circled heat loads represent the heat loads investigated
in this study.
[5]
Key Parameters
An important milestone in this study was the
identification of the variables to which the areal
mass of the TPS was most sensitive. This
sensitivity analysis was conducted on a node subject
to 85% of the total heat load for both TPS
constructions with PICA (Phenolic Impregnated
Carbon Ablator) as the ablator in each case.
Dual Layer: Most important variables for 85% Heat Load
Rank
Layer
Sized
Trajectory
Variable
Min Areal Mass
(% of nominal)
Max Areal Mass
(% of nominal)
1
PICA
A&E
Surface Roughness
85.70%
114.14%
2
PICA
A&E
LI-900 Allowable Temp
81.90%
103.92%
3
LI-900
A&E
LI-900 Density
99.21%
100.81%
4
PICA
A&E
PICA Conductivity
99.46%
100.38%
5
PICA
A&E
PICA Density
99.68%
100.16%
Single Layer: Most important variables for 85% Heat Load
Rank
Layer
Sized
Trajectory
Variable
Min Areal Mass
(% of nominal)
Max Areal Mass
(% of nominal)
1
PICA
A&E
Surface Roughness
89.73%
110.27%
2
PICA
A&E
RTV Allowable Temp
95.48%
104.52%
3
PICA
A&E
PICA Conductivity
96.72%
103.28%
4
PICA
A&E
PICA Density
98.35%
101.65%
Fig 7. Variations in Q
SP
for variations in key parameters
from their -3σ to +3σ uncertainty values. Note that
surface roughness and allowable temperature induce
the greatest performance variation and the nominal
performance of the dual layer is 16% greater than the
traditional monolithic TPS.
Performance Sensitivities
After identifying the key sensitivities in the
problem, the performance of both the dual layer
and traditional TPS was compared directly using
specific heat load, the parameter established in this
study, as the metric of interest. Both the absolute
performance and its sensitivity to changes in the
variables previously identified were investigated.
Below is a plot of specific heat load at the 85%
node. The red and green lines are the nominal
values for the dual and single layer constructions,
respectively. The vertical bars indicate the range
of variation in Q
SP
due to +/- 3 sigma changes in
each of the variables of interest.
Conclusions
A study was conducted with a new dual layer
thermal protection system and the traditional
single layer TPS to identify sensitivities in
performance to uncertainties in material properties
and aerothermal environments. A performance
metric, Specific Heat Load, was developed in
order to directly compare the results of the
traditional, dual layer and eventually, flexible
systems. Overall sensitivity in performance
increased with increasing heat load for both
systems as well as absolute performance. The
relative benefit of the dual layer system over the
traditional TPS is substantial across the board, but
decreases as the heat load increases. At the lowest
heat load investigated here, the relative
improvement was 36% and at full heat load the
benefit was 14%.
Fig 8. Variations in Q
SP
for variations in key parameters
- all nodes. Note that sensitivities increase with heat
load.
Fig 9. RSS Variations in Q
SP
for variations in key
parameters - all nodes. Note that the relative benefit of
the dual layer system is highest in the low heating
environment.
Cole D. Kazemba - Georgia Tech Space Systems Design Laboratory
Advisors: Dr. Robert Braun and Dr. Ian Clark
Co-Authors: Mary Kathy McGuire & Austin Howard – NASA Ames Research Center