Fillable Printable Standard Body Mass Index Chart
Fillable Printable Standard Body Mass Index Chart
Standard Body Mass Index Chart
M06
Miscellaneous Handouts • M06 Version 5.0Page 1 of 1www.move.va.gov
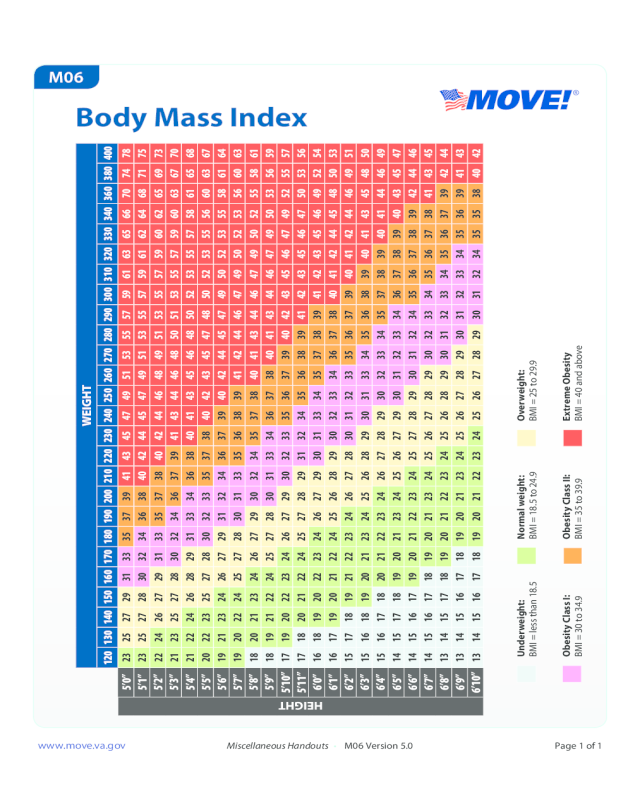
Body Mass Index
Underweight:
BMI = less than 18.5
Obesity Class II:
BMI = 35 to 39.9
Extreme Obesity
BMI = 40 and above
Normal weight:
BMI = 18.5 to 24.9
Overweight:
BMI = 25 to 29.9
Obesity Class I:
BMI = 30 to 34.9
WEIGHT
120130140150160170180190200210220230240250260270280290300310320330340360380400
HEIGHT
5’0”
2325272931333537394143454749515355575961636566707478
5’1”
2325272830323436384042444547495153555759616264687175
5’2”
2224262729313335373840424446484951535557596062656973
5’3”
2123252728303234363739414344464850515355575960636770
5’4”
2122242628293133343638404143454648505253555758616568
5’5”
2022232527283032333537384042434547485052535556606367
5’6”
1921232426272931323436373940424445474950525355586164
5’7”
1920222425272830313335363839414244464749505253566063
5’8”
1820212324262729303234353738404143444647495052555861
5’9”
1819212224252728303133343637384041434446474950535659
5’10”
1719202223242627293032333536373940424345464749525557
5’11”
1718202122242527282931323435363839414243454647505356
6’0”
1618192022232426272930313334353738394142434546495254
6’1”
1617192021222425262829303233343637384041424445485053
6’2”
1517181921222324262728303132333536373940414244464951
6’3”
1516181920212324252628293031333435363839404143454850
6’4”
1516171820212223242627282930323334353738394041444649
6’5”
1415171819202123242526272930313233343637383940434547
6’6”
1415161719202122232425272829303132343536373839424446
6’7”
1415161718192021232425262728293032333435363738414345
6’8”
1314151718192021222324252628293031323334353637394244
6’9”
1314151617181920212324252627282930313233343536394143
6’10”
1314151617181920212223242526272829303132343535384042