BMI Chart
- DOCUMENTS
- GUIDANCE
Edit & Download
Edit & Download
Edit & Download
Edit & Download
Edit & Download
Edit & Download
Edit & Download
Edit & Download
Edit & Download
Edit & Download
Edit & Download
Edit & Download
Edit & Download
Edit & Download
Edit & Download
Edit & Download
Edit & Download
Edit & Download
Somebody rightly said, “It is health that is real wealth.” Having a good health is the greatest blessing one can have, isn’t that? Yes! Good health depends on a lot of factors including healthy and nutritious food, daily activities, exercises and state of mind, of course. Now considering the over-demanding working schedules today, leaves one question, “Are you really healthy?”No matter how busy you are, constant monitoring of your health and having a clear picture of where your fats are going is very essential. How are you going to do that? Well, with a BMI chart.
Let’s start with BMI
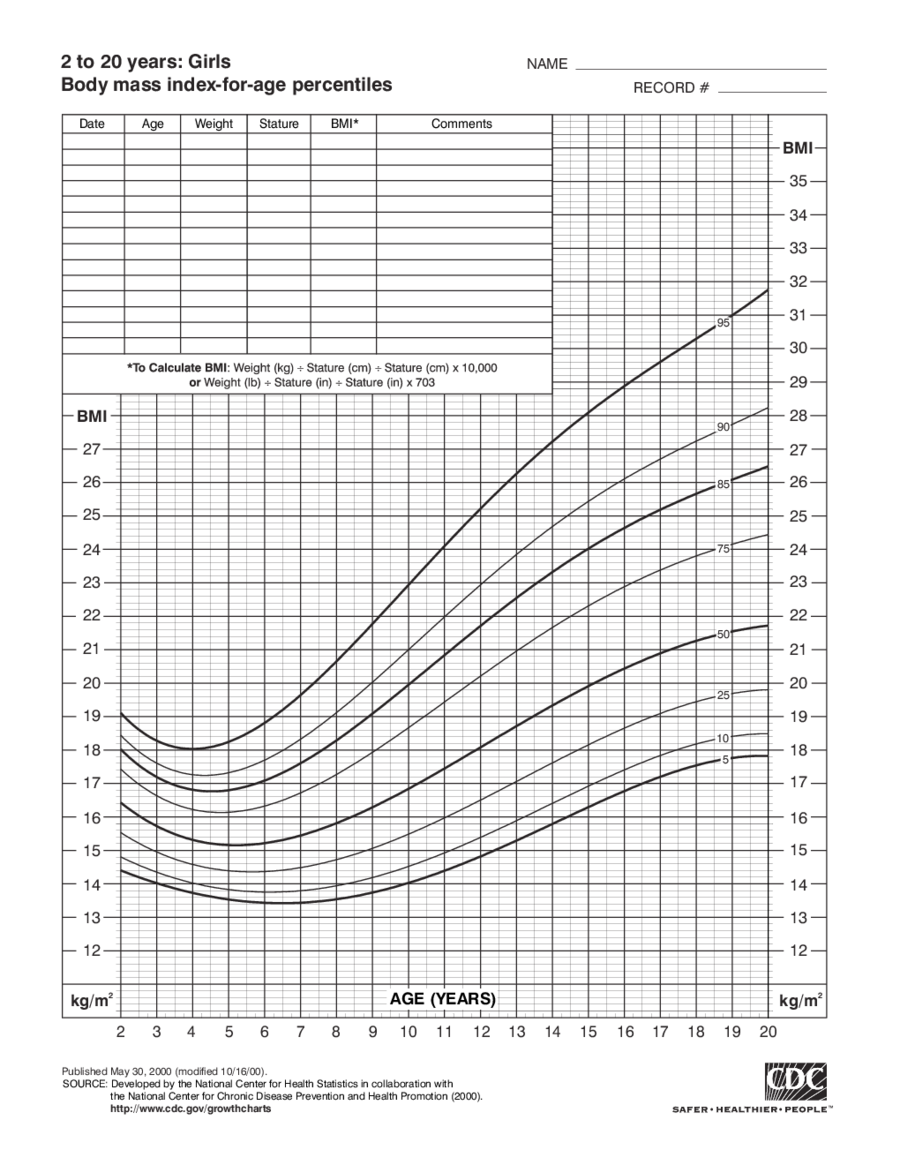
BMI expands to Body Mass Index. This is an established and largely accepted tool that helps you to determine the scale of your obesity and how healthy or unhealthy you are. BMI is basically the measurement of your body fat that is calculated based on your weight and height. It can determine clearly whether you are obese, overweight, underweight or perfectly healthy. BMI is very simple and in-expensive.This index applies to all, regardless of gender but above 20 years of age. However, BMI percentile gives the best assessment for children who are aged between 2 to 20.Now, what is BMI chart?
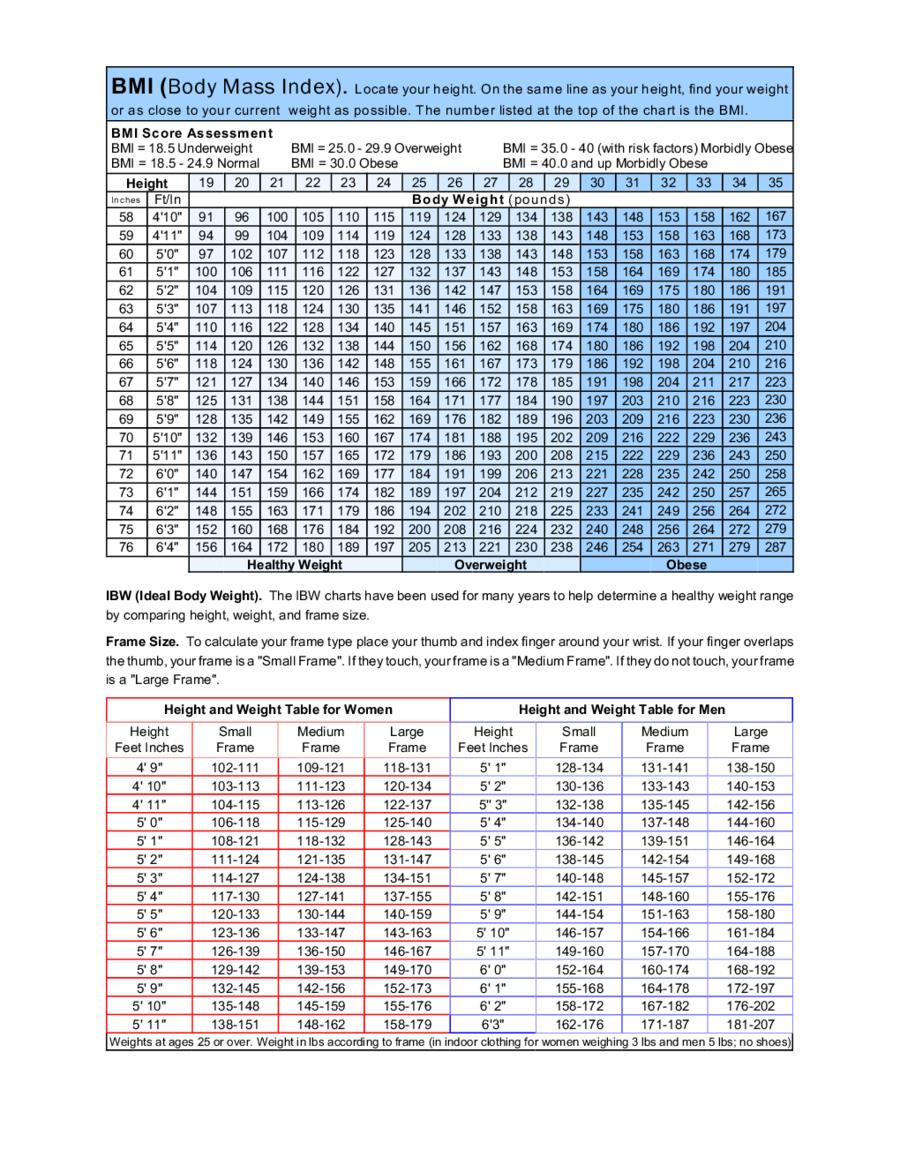
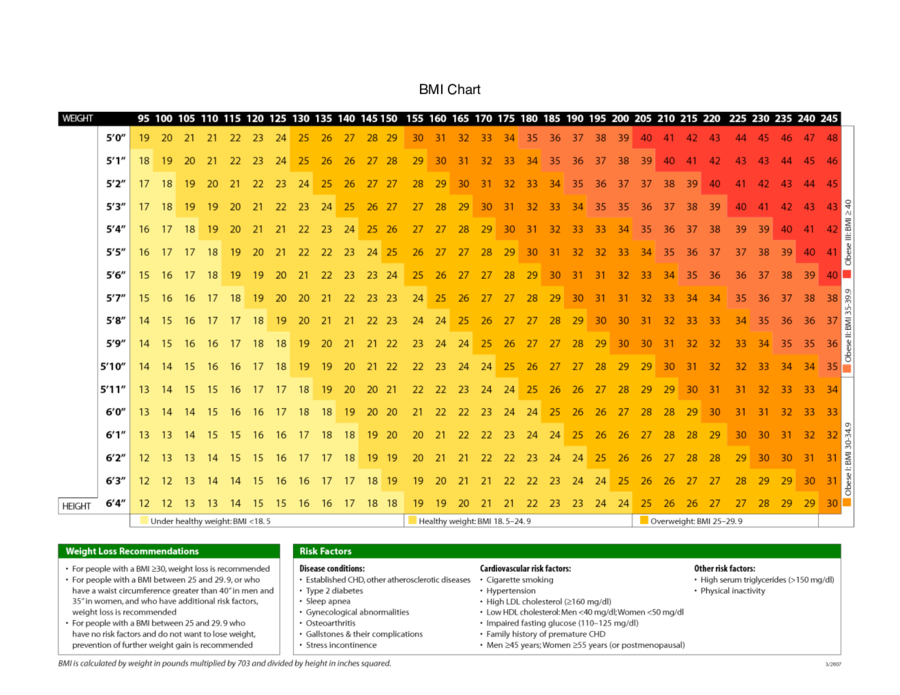
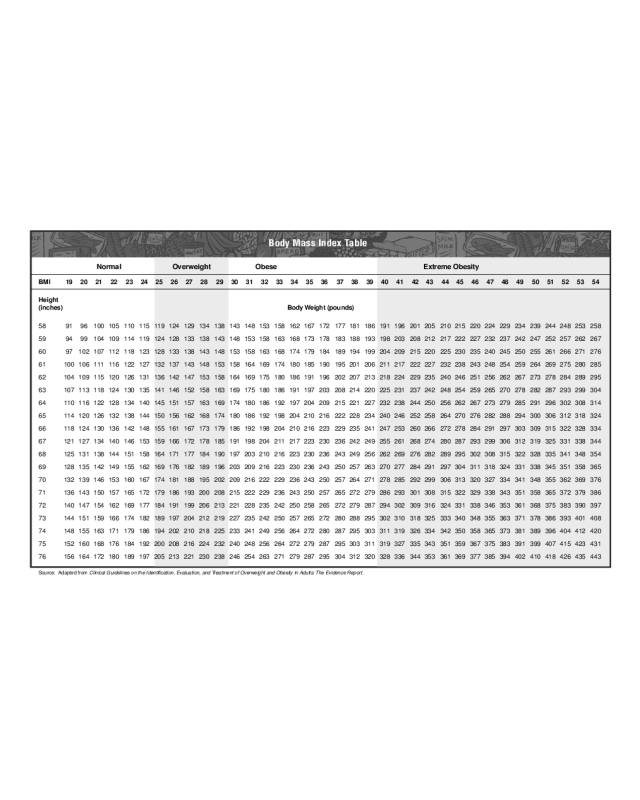
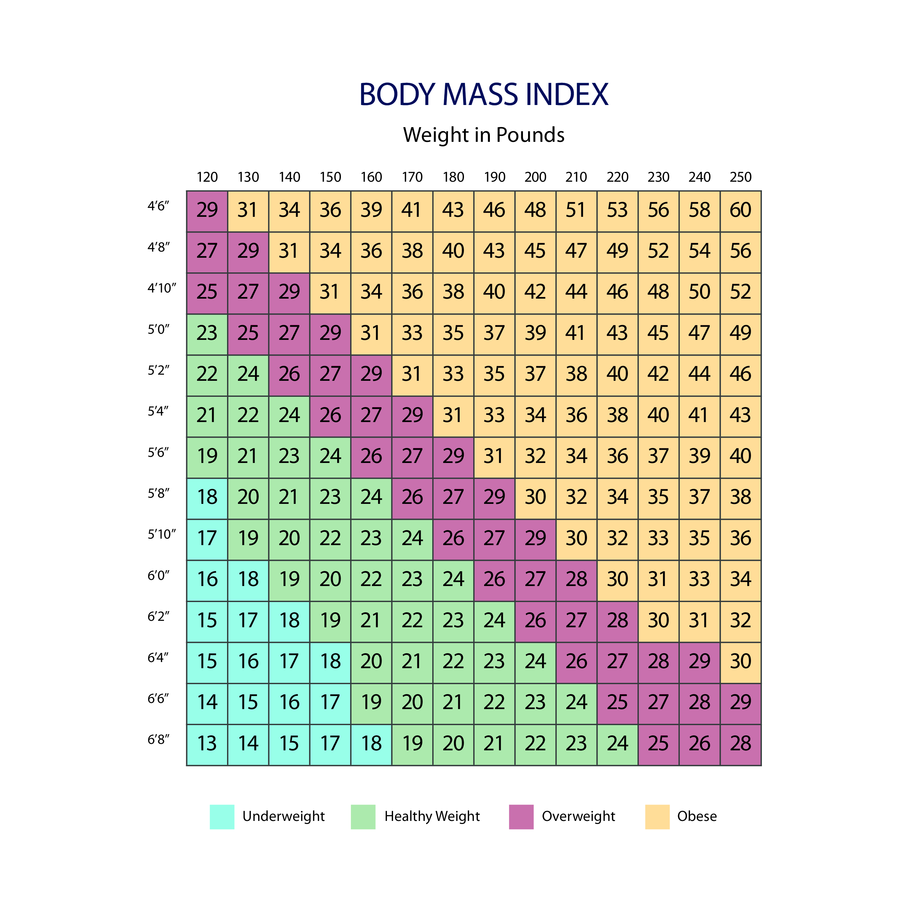
BMI chart is used to check your body mass index. It is this chart that keeps a plot on your height and weight for getting body mass index. The chart is quite handy to track your health condition constantly.According to World Health Organisation (WHO), the healthy range for BMI for adults is 18.5 and 24.9.Take, for instance, a person is 5’9” and has a BMI below 18.5; he would be considered to be underweight. If the range lies between 25.0 and 29.9, that denotes he is overweight. Between 18.5 and 24.9 is normal and above 30 is obese.So, that’s how it shows the results.Remember, fats are your biggest enemy. They need to be cut down!Why should you have a healthy weight?
The question may sound silly but yes, it is important to maintain a healthy weight. Most people today spend their days through unbalanced and extremely busy plans. It’s hard for them to even check on their daily food intakes, keep aside weight.But amidst all these, you have to have a healthy weight and maintain fitness. Wondering why?Here’s the answer
- More active and increased energy
- Reduced pain in joints and muscles
- Sleep patterns are improved
- Burden on circulatory system and heart is reduced
- Risk of heart problems like attacks are less
- Improved body pressure and other fluids
- Less chances of certain cancers
- Brings down blood glucose
Do you know BMI has these functions too?
The Body Mass Index can not only determine your obese scale, but also correlates to other important areas of health. A person with higher BMI suggests that he has high risks of–- Stroke
- Heart disease
- Hypertension
- Type 2 diabetes
- Osteoarthritis
- Gallstones
- Breathing problems
- Cancer
What is the advantage of using BMI chart?
BMI is very popular for its quick and effective assessment of your weight classification. Although it does not measure the body fat directly, but it can accurately calculate the approximate degree of fatness besides weight.In the chart, you don’t have to have an exact measurement for being in normal health. Each classification has a range for matching up with different body shapes and types. As for instance, if two people are of same height but one is 10 to 15 pounds heavier than the other, then both of them can still fall in the normal range.This is much convenient compared to any other invasive methods of weight calculation. However, if you take this chart to your doctor, he can then make an overall and accurate assessment of your physical condition.General people are not health specialists. So, with body mass index, they can set a goal to aim regarding fitness and improve weight scale accordingly.A sneak peak to what obesity actually is
To most people, concept of obesity is not clear yet. Obesity is that condition when a person has gained too much body fat, ultimately having a negative effect on health. The reasons why people become obese are –- Sedentary lifestyle
- Irregular sleeping habits or not sleeping enough
- Eating too much food and thus consuming much calories
- Certain medications that make you gain weight
- Endocrine Disruptors
- FTO or obesity gene
How would you use a BMI chart?
The BMI formula
BMI calculation has two formulas –- Metric (Weight (kg)/ Height (m)2) –
- Imperial ((Weight (lbs.) x 703) / Height (inches)2) –
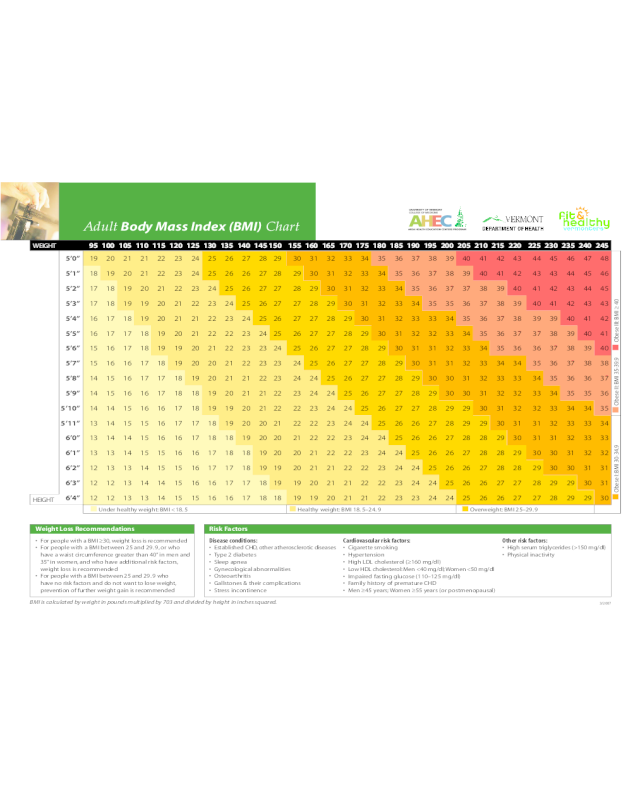
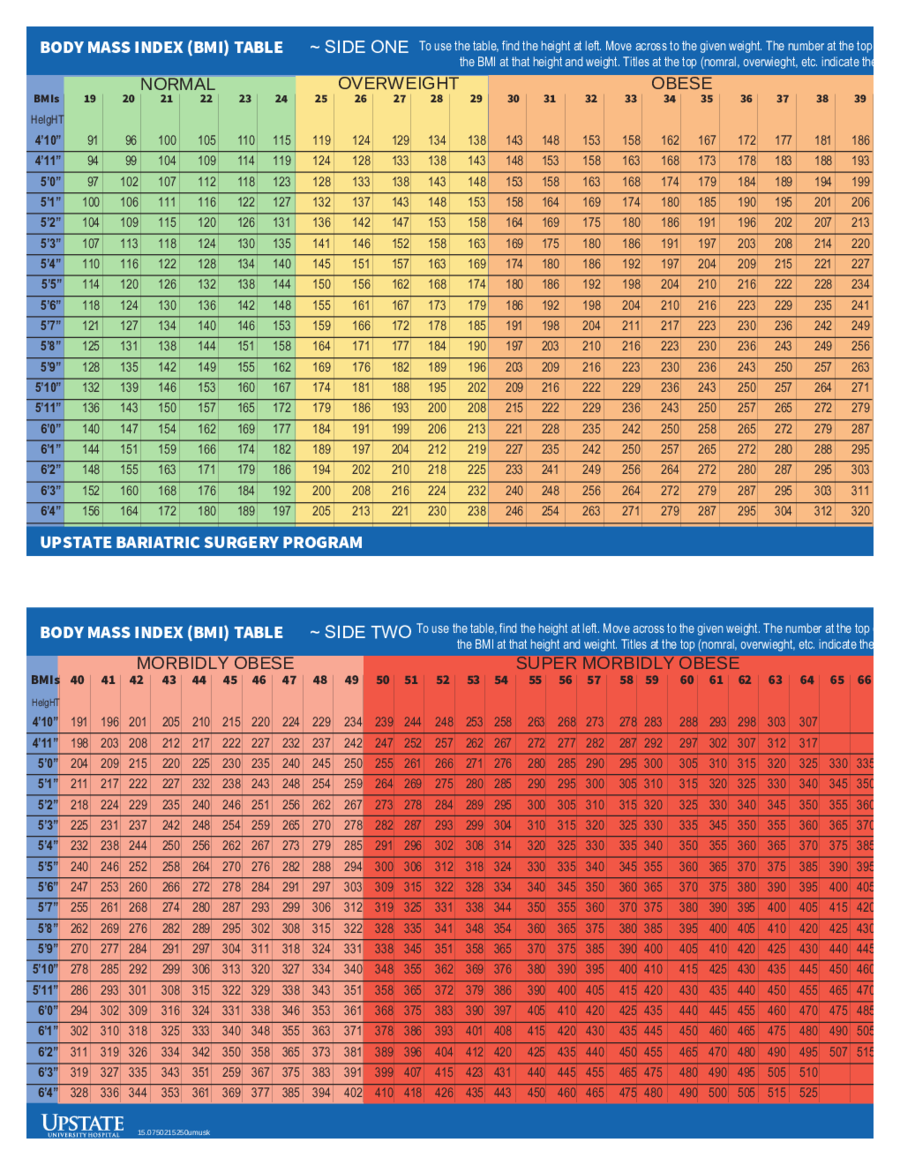
BMI table can help
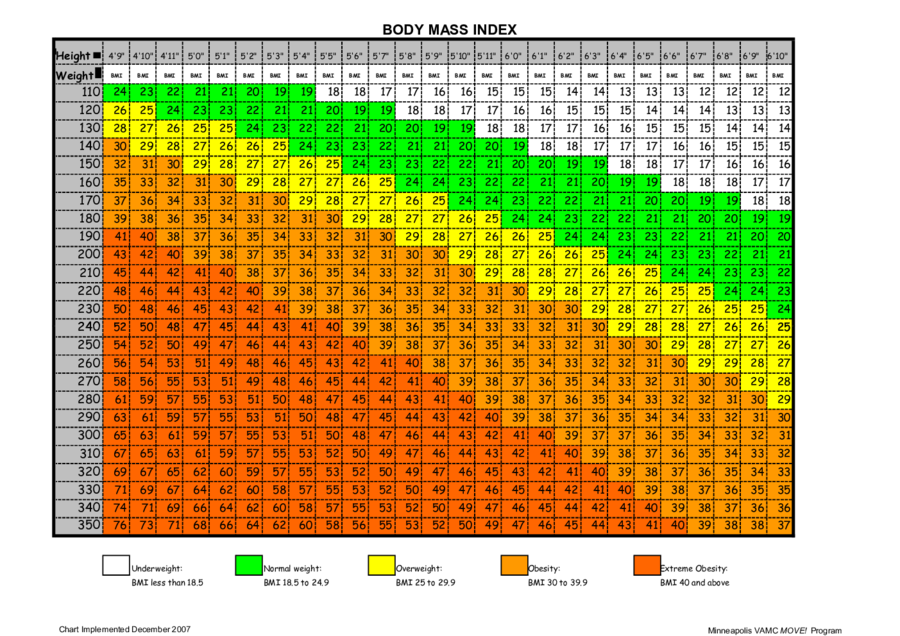
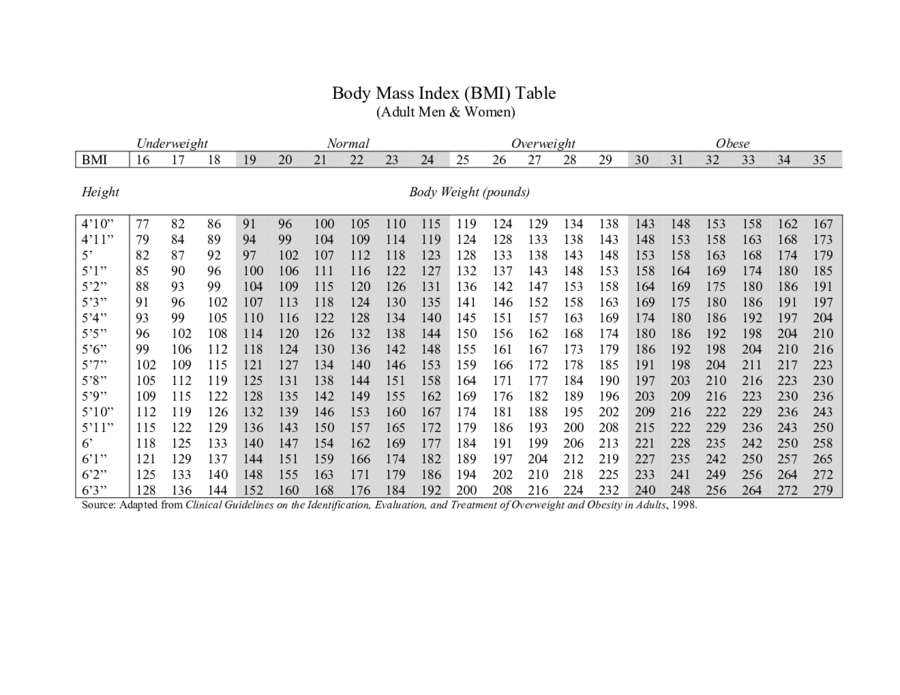
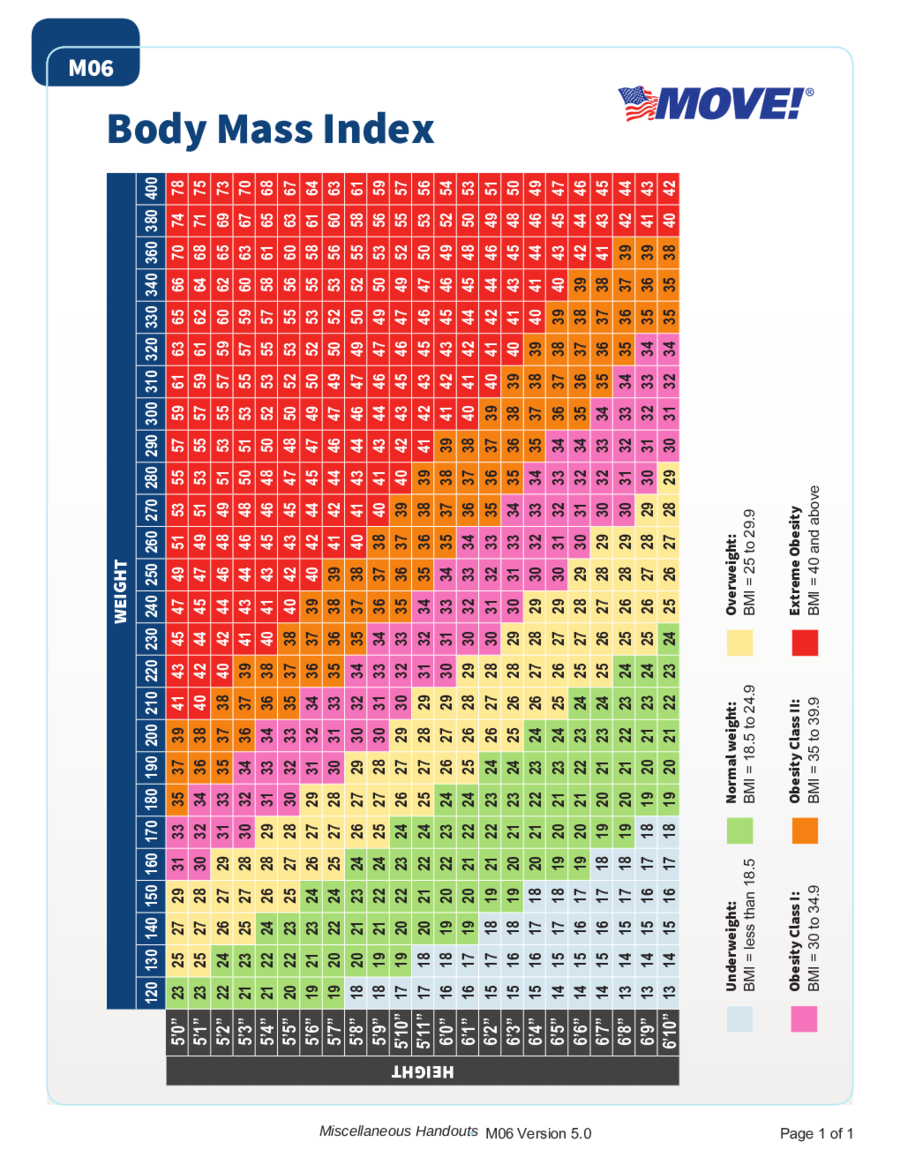
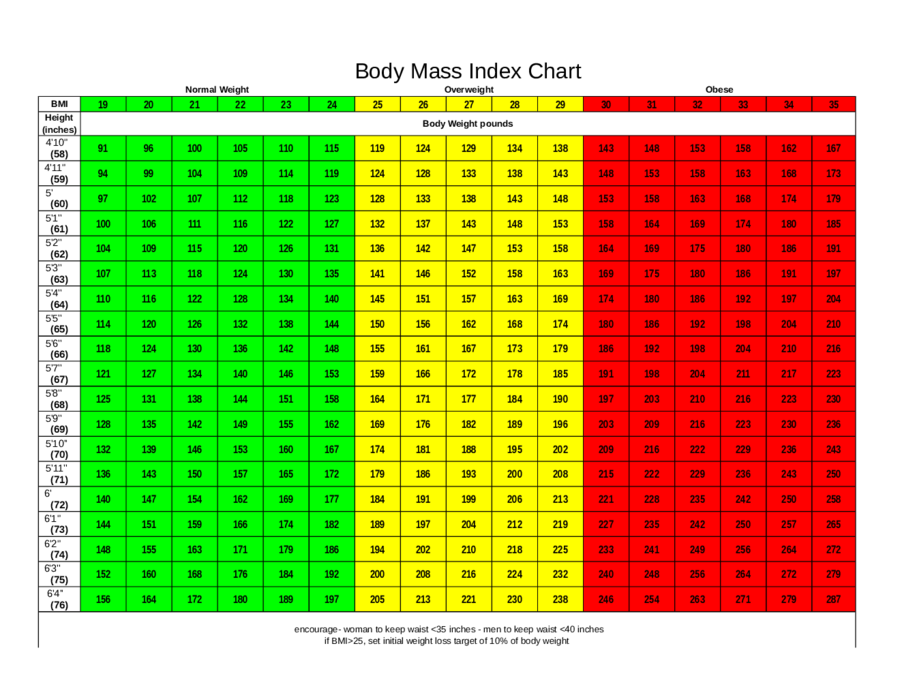
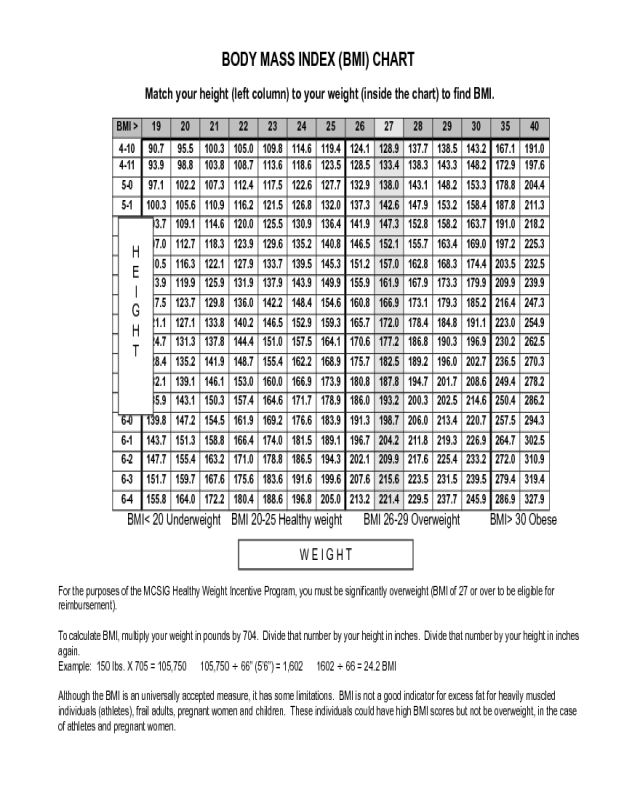
Although this might seem to be a bit complicated but with a little practice, you can quickly make the calculations. The chart will ease this whole method. It has a complete calculated range given as graphical representation where you can check your weight status quite conveniently.The results are very easy to understand in a BMI table – simply look at the scores on the standardized chart and you get it. On the vertical axis is the height and on horizontal axis is the weight. Shaded portion gives the scores.- Less than 18.5 – Underweight: Here, you must put on some weight taking advice from your doctor. Follow a proper diet chart.
- Between 18.5 and 24.9 – Normal: Both your height and weight are normal and healthy. So, there’s less risk of serious health issues.
- Between 25 and 29.9 – Slightly overweight: You might need to shed some fat and lose weight. You need to change your diet habit a little.
- Above 30 – Obese: That’s being heavily overweight. Clearly, you are a risk of developing diseases and need to reduce weight at the earliest. See you doctor for right treatment.
Tables for both men and women
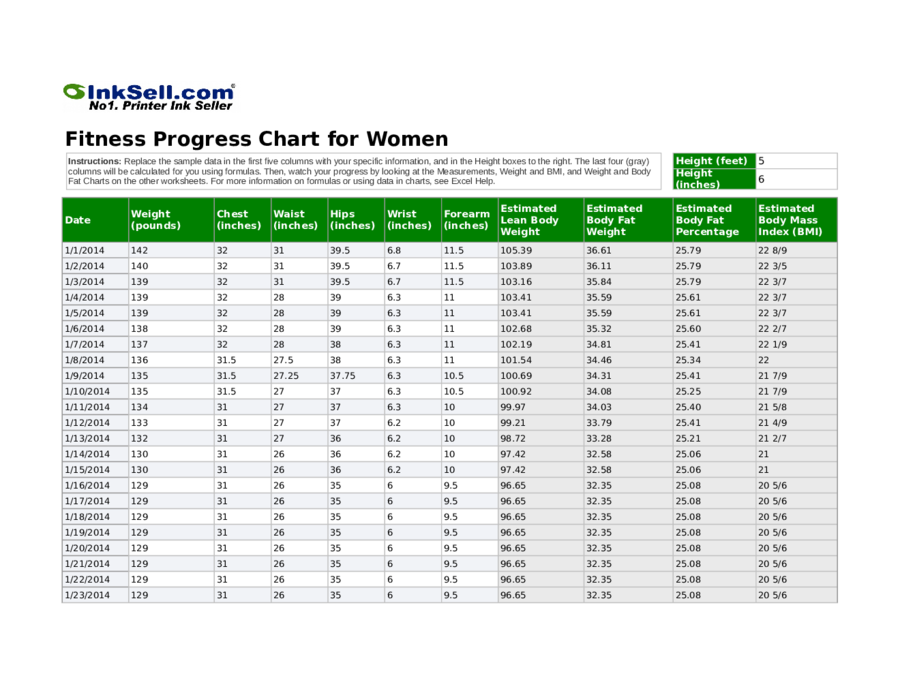
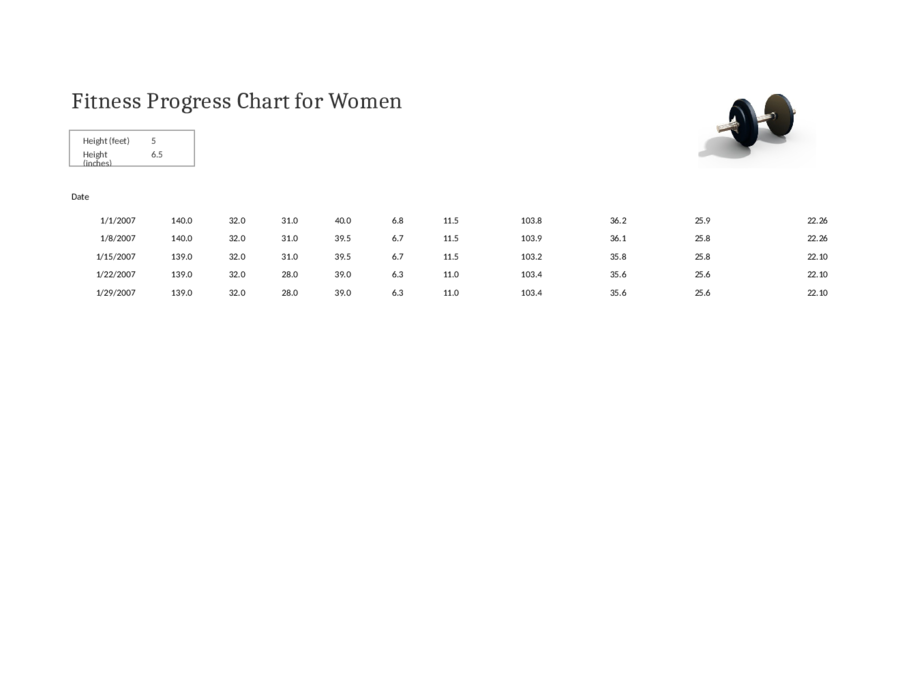
You will get BMI charts for both men and women. Both the genders can take advantages of the tables to determine their current health status and follow regime to improve. A BMI chart for women is adjusted to reflect their various conditions. The results are based on different body proportions of men and women.Usually, women between the ranges of 15 to 25 are considered to be normal. However, the better is your score the better will be your metabolism and energy. It ensures the person has high resistance to diseases and sickness. If you find, you fall in the obese category, it is important to be serious regarding losing your weight.Similarly, there is BMI chart for men that have been adjusted with scores according to different conditions of a man’s body proportions. Keep a track on your weight and stay in good physical shape.BMI percentile for children
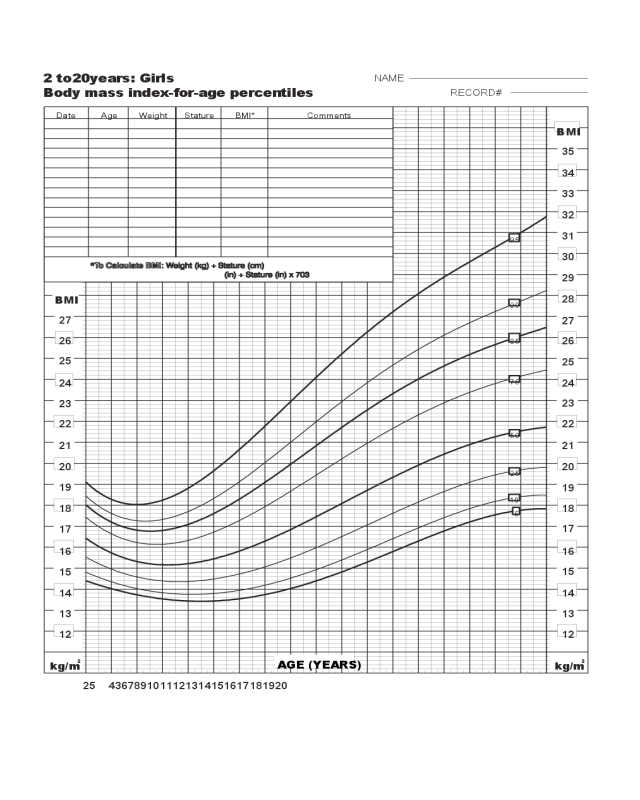
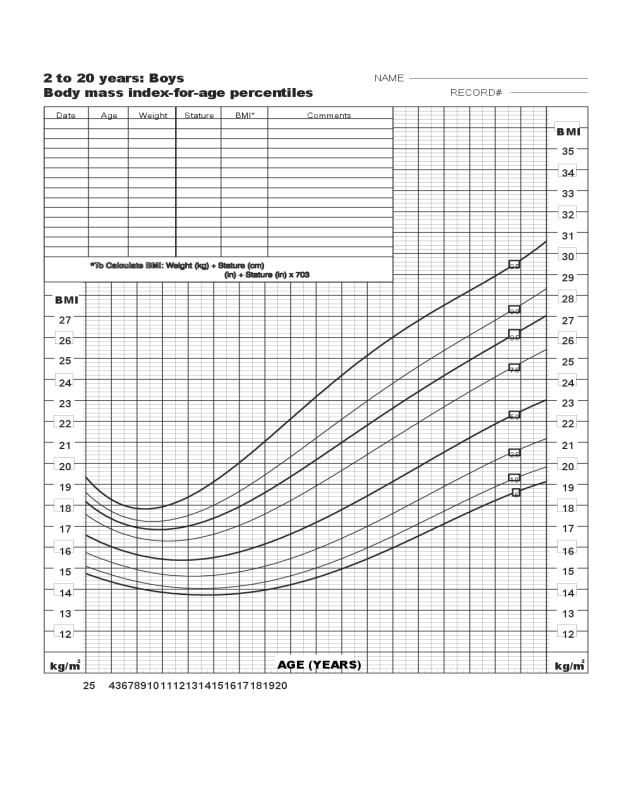
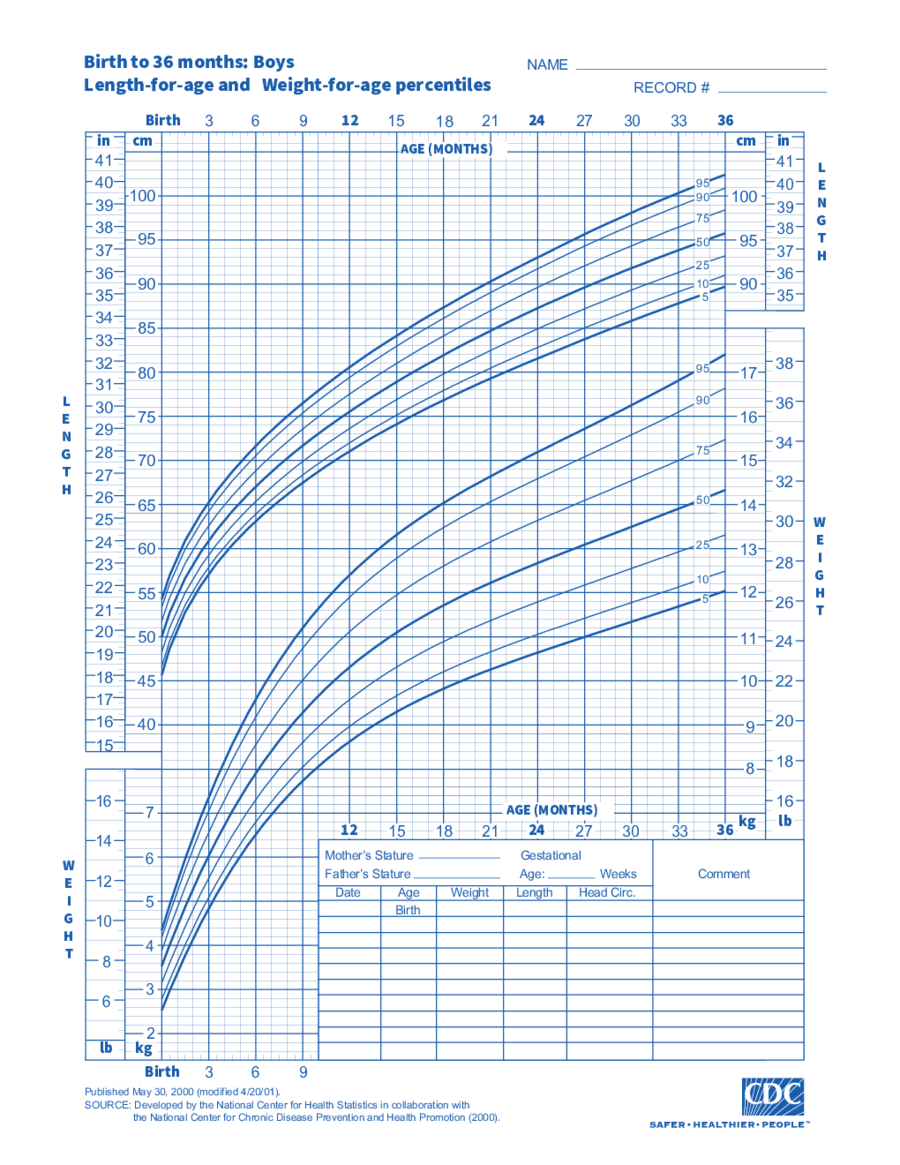
Besides men and women, the other category who is a major victim of obesity today is children and teens. These young people are more quickly affected by hazardous health problems due to their excessive weight in their childhood and even into adulthood.Problems associated with child obesity
- Sleep apnoea
- Diabetes (Type 2)
- Asthma
- Low self-esteem
- Other psychological stresses, etc.
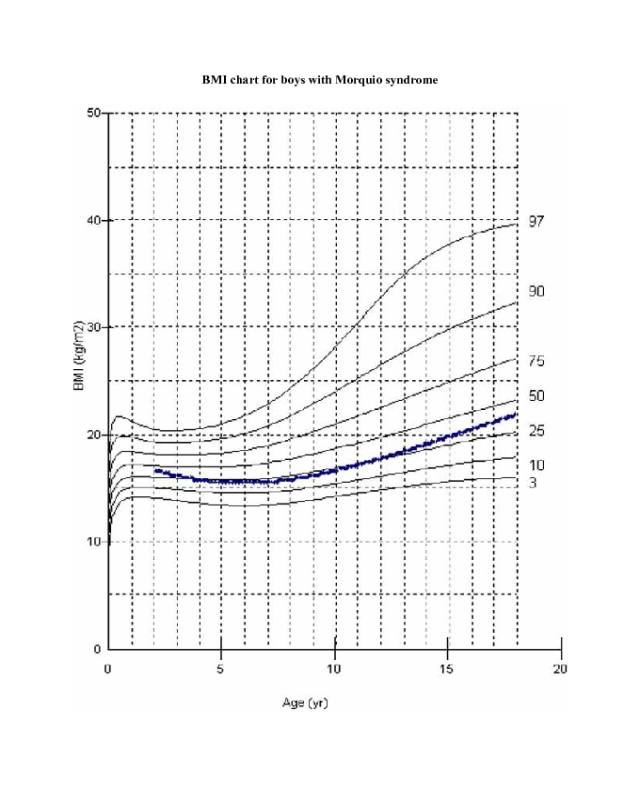
Reading percentile chart
- Below 5th percentile: Underweight
- 5th to 84th percentile: Healthy weight
- 85th to 94th percentile: Overweight
- 95th percentile or above: Obese
Last Words
When the levels of obesity and related problems are increasing across the world, anything that educates people regarding their weight is always beneficial for the person. As BMI chart is an effective tool to determine risks of high blood pressure, stress, diabetes, heart disease, etc., you can manage your health perfectly in the long-term and live a disease free life. Related Categories
Health Care Proxy FormHealth History FormHealth Care Claim FormHealth Assessment FormAnimal Health Certificate FormHealthcare Enrollment FormHealth Questionnaire FormHealth Consent FormHealth Referral FormBlood Pressure Log ChartBlood Pressure ChartMeal Planning TemplateMileage Log30-Day Workout PlanWeight Loss Chart


