Fillable Printable Urine Color Dehydration Monitor Chart
Fillable Printable Urine Color Dehydration Monitor Chart

Urine Color Dehydration Monitor Chart

Devils Postpile
National Monument
California
National Park Service
U.S. Department of the Interior
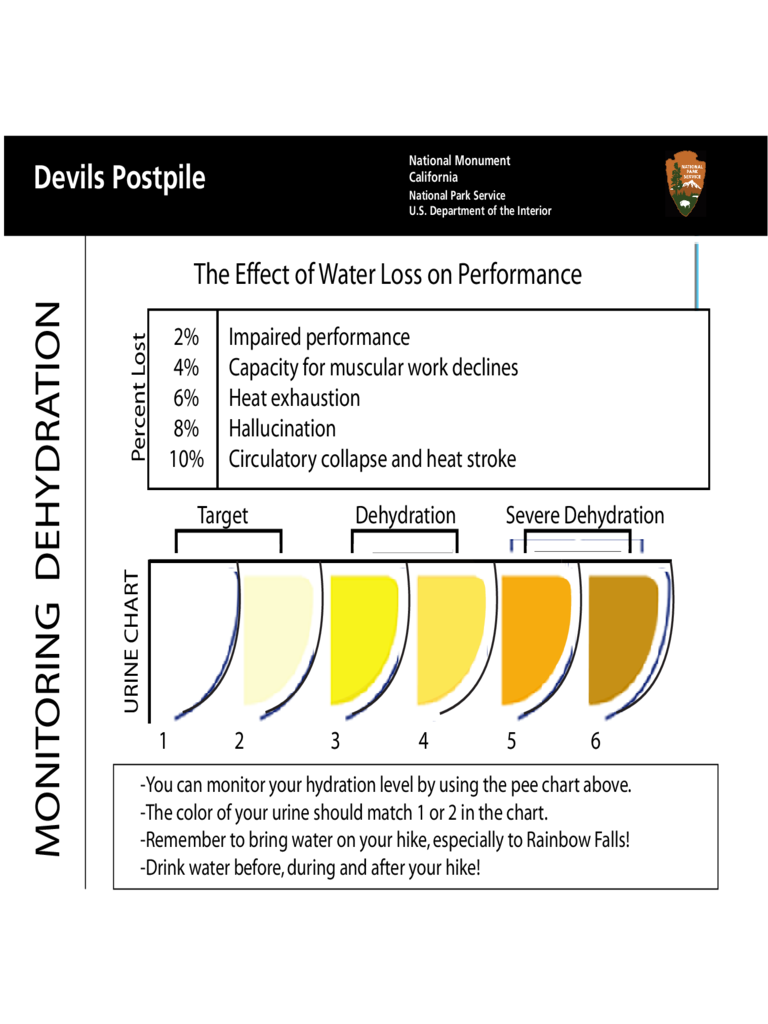
The Effect of Water Loss on Performance
2%
4%
6%
8%
10%
Impaired performance
Capacity for muscular work declines
Heat exhaustion
Hallucination
Circulatory collapse and heat stroke
Target Dehydration Severe Dehydration
MONITORING DEHYDRATION
-You can monitor your hydration level by using the pee chart above.
-The color of your urine should match 1 or 2 in the chart.
-Remember to bring water on your hike, especially to Rainbow Falls!
-Drink water before, during and after your hike!
1 2 3 4 5 6
URINE CHART
Percent Lost


