Fillable Printable Dynamic Balanced Scorecard Template
Fillable Printable Dynamic Balanced Scorecard Template
Dynamic Balanced Scorecard Template

A DYNAMIC BALANCED SCORECARD TEMPLATE
FOR PUBLIC SECTOR AGENCIES
Keith Linard, Senior Lecturer
Merilyn Bassett, Visiting Fellow
Joseph Yoon, Postgraduate Student
Lubomir Dvorsky, Postgraduate Student
University of New South Wales, (Australian Defence Force Academy)
ABSTRACT:
This paper describes a dynamic balanced scorecard template developed for the Australian
Federal Department of Communications Information Technology and the Arts (DCITA) by a
research team from the University of New South Wales and CSC(Aust) in conjunction with
senior DCITA executives and ministerial staff.
The project involved the development of a prototype management flight simulator, built
around the Kaplan and Norton 'balanced scorecard' (BSC) concept. The engine for the
simulator is a system dynamics model, built in Powersim, designed to draw real time data
from departmental information systems. The prototype was designed as a template that could
be customised for any level of the organisation.
The model is broadly structured around the traditional BSC sectors, adapted for the Australian
public sector environment. It incorporates the following sub-models:
• Resources: (human capital; outsourced services)
• Internal Process: (workflow; corporate communication)
• Customer Perspective: (service quality, corporate governance & corporate health)
• Learning & Growth: (intellectual capital; personnel development)
The paper includes illustrations of causal loop and stock flow diagrams of key components.
Keywords: system dynamics; causal loop; balanced scorecard; knowledge management;
performance management; public sector management.

PERFORMANCE MANAGEMENT - AUSTRALIAN PUBLIC SECTOR CONTEXT
The Australian Public Sector has undergone a series of reforms in recent years with the aim of
providing the government of Australia with the services it requires in a rapidly changing
world. The pressure for reform has been driven by both international and domestic
developments including globalisation, technological change, policy initiatives, the changing
workplace environment and the demographics of the primary provider of services, the
Australian Public Service (APS).
The suite of financial, employment, competition and customer service reforms focuses on
developing a more business-like performance culture within the public sector. These reforms
provide the opportunity to develop a Balanced Scorecard for Australian Public Sector
agencies that assists managers to assess service delivery performance and the capacity to
adapt in a rapidly changing environment.
Federal Government Resource Management Reforms of the 1990’s
A key policy of the current government for a high performing public sector is to build a
stronger budgetary position through expenditure restraint and concentration on core business.
1
A range of the recent resource management reforms are briefly outlined below to assist in
clarifying the customer/service provider relationship that exists in the Australian federal
public sector context and which differs substantially from a public sector that primarily
provides services direct to the community.
The resource management approach implemented by the Australian Public Sector (APS) in
July 1999 consists of an outcomes, outputs, accrual based budgeting and reporting resource
management framework, supported by devolved banking and financial management systems.
The essential purpose of the outcomes and outputs framework is to answer three questions:
(i) What does government want to change? (outcomes)
(ii) How does it want to make that change? (outputs)
(iii) How does it know if it is succeeding in making that change? (indicators)
The system works as a hierarchy. Government, through its ministers and with the assistance
of relevant agencies, specifies the outcomes it is seeking to achieve in a given policy arena.
These outcomes are specified in terms of the impact government is aiming to have on some
aspect of society, the economy or the national interest. Parliament appropriates funds to allow
the government to achieve these outcomes.
These funds allow government to ‘buy’ outputs or services from agencies. Agencies specify
the outputs (eg. policy advice) they undertake to provide to contribute to the achievement of
these outcomes, including through third parties.
Specification of what will be delivered can help improve the understanding and knowledge of
those outside the agency who have an interest in its performance, including Ministers,
Parliament and external accountability bodies such as the Auditor General.
The framework encourages agencies to focus on the specific products they deliver (outputs)
and how to deliver them in the most efficient and effective ways; and to identify business
lines they should drop or outsource. The implementation of accrual accounting using
1
The Hon. John Howard, MP, Prime Minister: Launch of Ethical Standards and Values in the Australian Public
services – MAB/MIAC publication No. 19, 9 May 1996.

generally accepted accounting principles provides the basis for benchmarking comparisons so
that decisions about preferred providers are better informed.
Annex 1 illustrates the typical way a work unit might develop its work action plan, identifying
the planned outcomes and outputs, resources required and agreed, performance criteria and
other work units whose activities impinge on achievement
Where services are provided direct to industry and the community, the development of client
service charters is an integral part of the reforms and an important indicator of performance.
The Government itself makes decisions on programs and (usually) on guidelines for service
provision. Within these guidelines, however, governments expect service delivery to be of a
high standard and public servants are accountable to their Minister and to government for
their service to customers in this context.
Charters must specify standards for service delivery and set out complaint handling and
feedback mechanisms, and must be developed through consultation with customers and staff.
Agencies are required to report annually, through the Department of Finance and
Administration, to the Parliament on their performance against the charter.
The reforms outlined above provide a more complex view of the customer perspective for the
Australian national public sector then that which exists in the private sector. In the public
sector context, the prime customer (ie the agent who pays for a reciprocal service) is the
Minister on behalf of the Government.
CHARACTERISTICS OF AN AUSTRALIAN GOVERNMENT BSC
The ‘Customers’ of the Federal Public Sector
Much of the writings on implementing the Balanced Scorecard in the public sector focuses on
levels of Government that provide services direct to the community. However, in Australia,
community services are primarily the responsibility of State and Local Governments. As
noted above, the primary function of the Australian Federal Public Sector is to provide a
range of services to the Government through the Minister responsible for the function.
Departments also have a legal requirements which set up ‘customer relationships’, especially
to the Auditor General and to the Parliament in respect of ‘governance’.
In those cases where Federal Departments do provide services direct to the public, they are
required to prepare and implement a service charter, providing a clear ‘customer relationship’.
Thus there are three ‘Customers’ who may need to be addressed in a BSC:
• for most departmental activities, the Minister, and through him/her, the Government;
• in respect of governance, the Auditor General and Parliament, as well as the Minister;
• for service delivery activities, the corporate or individual service recipients.
The BSC template that has been developed focuses specifically on the relationship between
managerial responses to any ‘workload-resourcing’ gap (the ‘Capacity Gap’), and how this
impacts on the first two ‘Customers’ above. The model outputs relate specifically to output
quality index; probability of fraud / probity incident; and probability of EEO incident.
The following causal loop diagrams illustrate the mechanisms by which these are impacted by
departmental operations. The interrelationships between the respective work area outputs and
their impact on achievement of outcome indicators is subject of a separate study.
Resources Performance Management in the Federal Public Sector
Over 90% of Federal Government CEOs consider financial results to be one of the top three
indicators of their organisation’s success. However, financial management in these agencies
differs dramatically from the private sector context in that the revenue side of the budget is a
given, and the focus is simply on effective and efficient management of the expenditure.
The quantum of funds made available to a Minister to implement Government programs is the
end result of a complex interplay of macro-economic deliberations, ministerial bargaining and
political judgement. Issues regarding what can be delivered (in terms of quality and quantity)
for the proposed funds are significant inputs. But such relationships are largely
approximations. Lack of skilled management (for example as a result of high turnover or
overwork) can result in errors in estimating required workload.
When the Government has determined its policy, the bureaucracy has only minor leeway in
changing the quantum or time schedule of the service. In addition, a variety of unplanned
business pressures inevitably impact on planned business. Unforeseen events such as fraud
within the Department, a by-election in a sensitive electorate, or a major controversy relating
to the Minister’s policy responsibility inevitably generate workload which is expected to be
‘absorbed’. The resource management task is to deliver the planned outputs within budget.
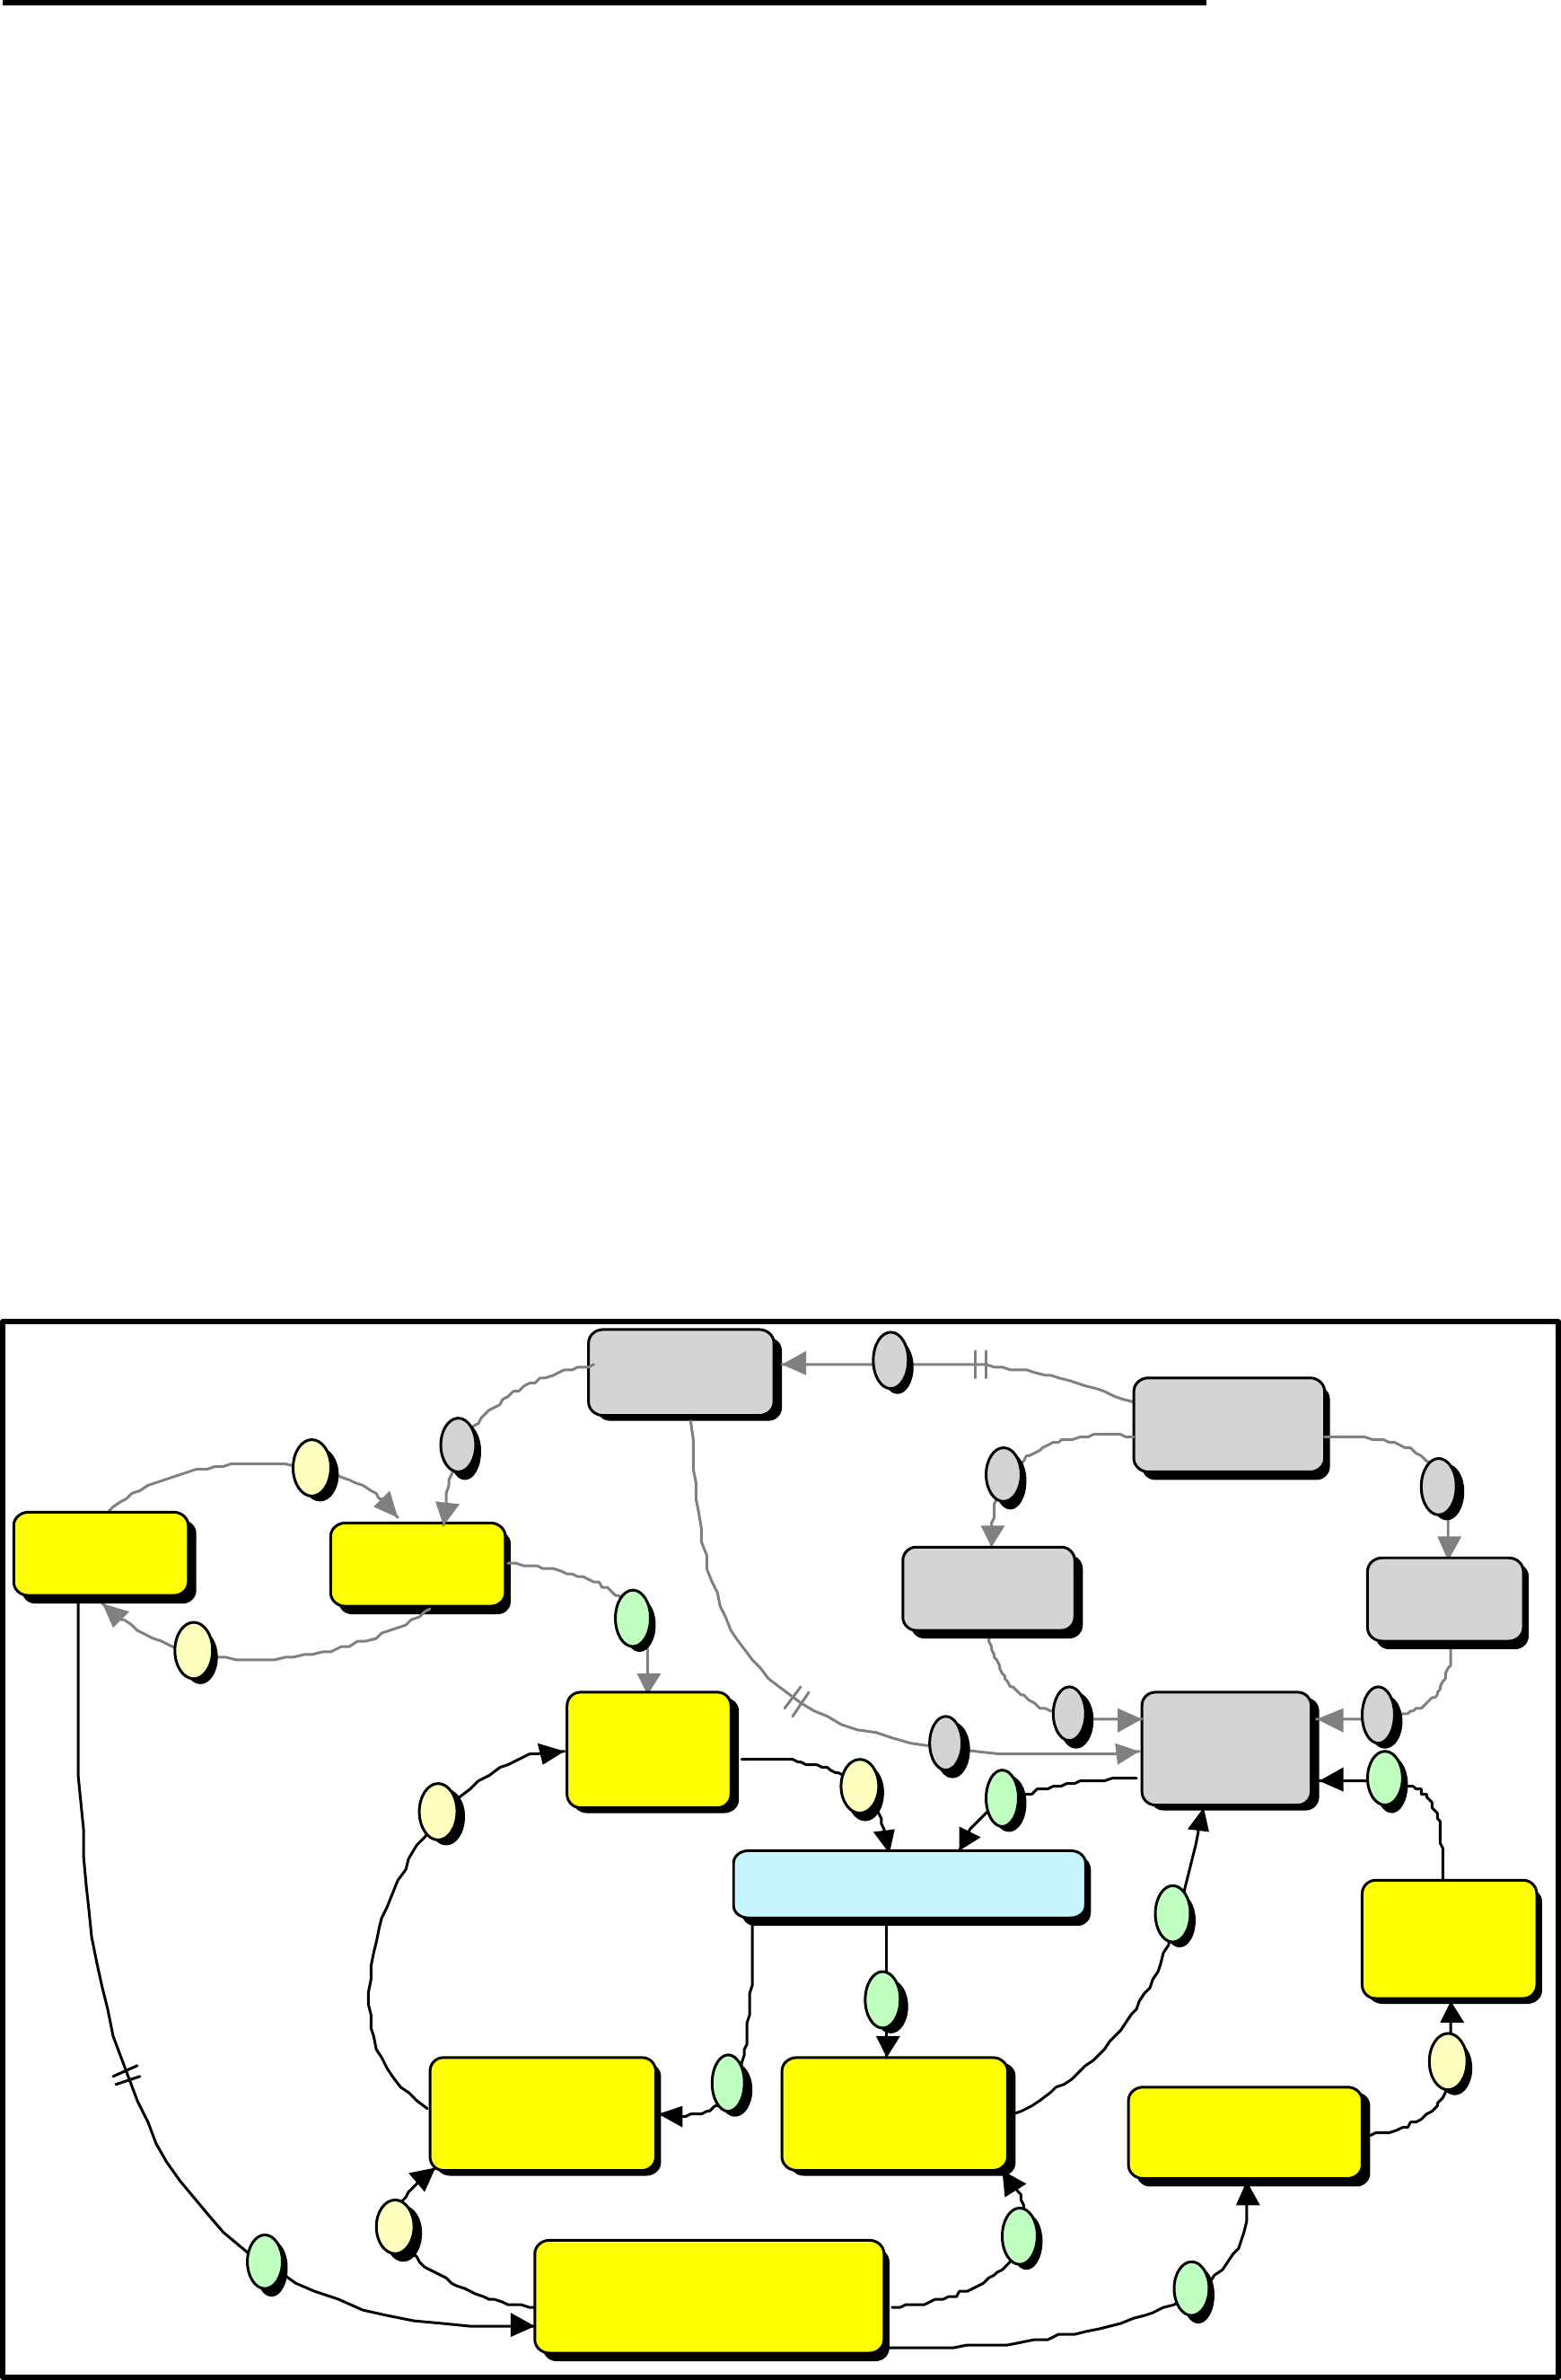
Figure 1 illustrates interrelationships in the resource sector. ‘Customer Demand’ represents
the Government’s (through the Minister) expectations which also determines the resourcing
level. It is almost axiomatic that available resources will be less than that required for quality
implementation of all the planned workload, let alone the inevitable unplanned demands.
Whether the management response to any ‘capacity gap’ is innovative or dysfunctional is a
function of the organisational competencies, which in turn is the result of leadership and
investment in capability, the latter balancing short term impacts on recurrent resources.
Figure 1: Key Resource Sector Interdependencies in Federal Departments
Department
Resources
s
Annual
Workload
Planned
Recurrent
Resources
Customer
Demand
s
o
o
Business
Planning
Errors
s
s
s
s
s
s
o
s
s
'New'
Business
Base Load
Business
Total
Effective
Capacity
Capability
Investment
CAPACITY GAP
o
Management
Effectiveness
Dysfunctional
Responses to
Gap
Innovative
Responses to
Gap
o
s
s
s
Learning Organisation
Competencies
s
o
s
s
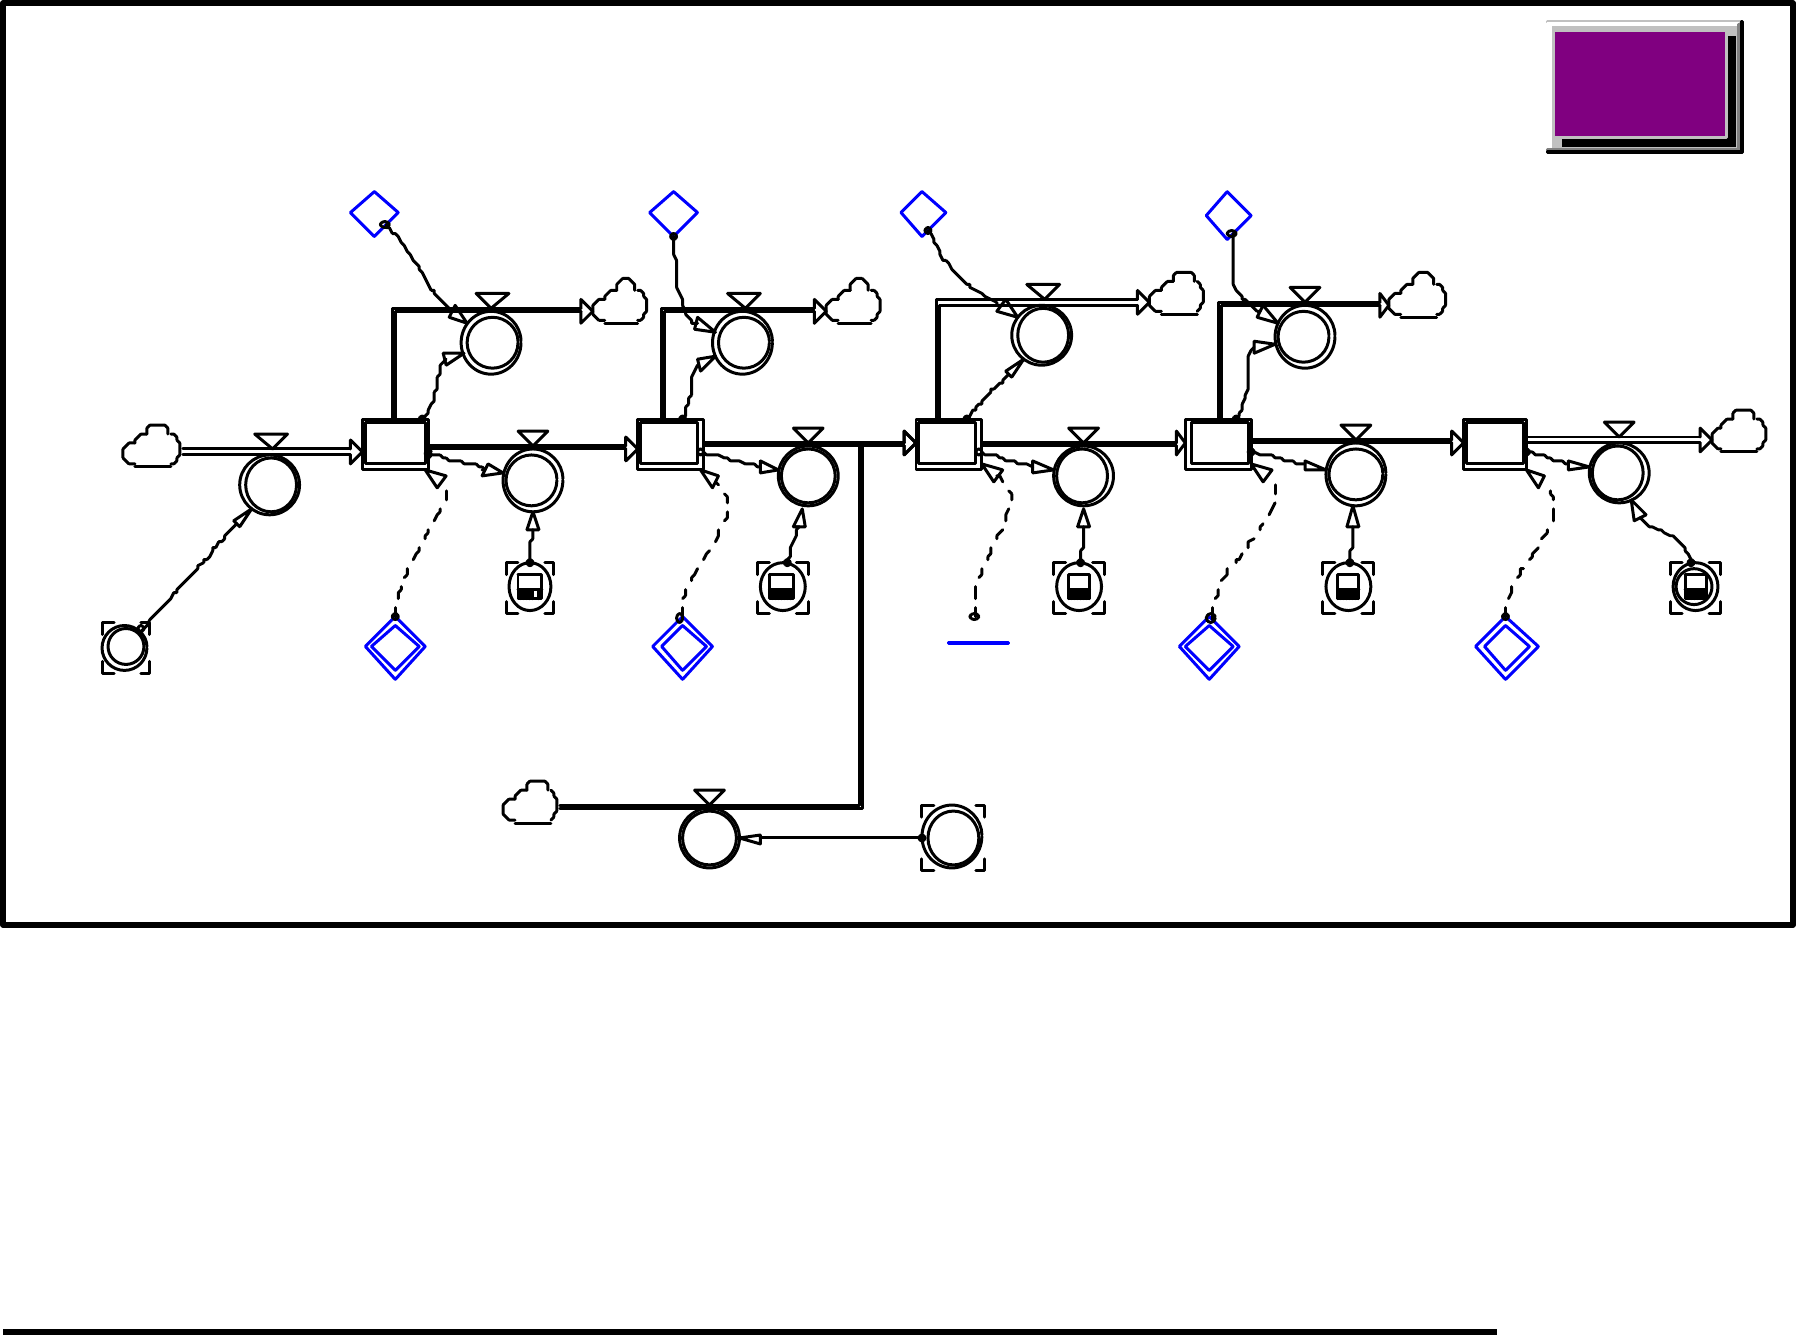
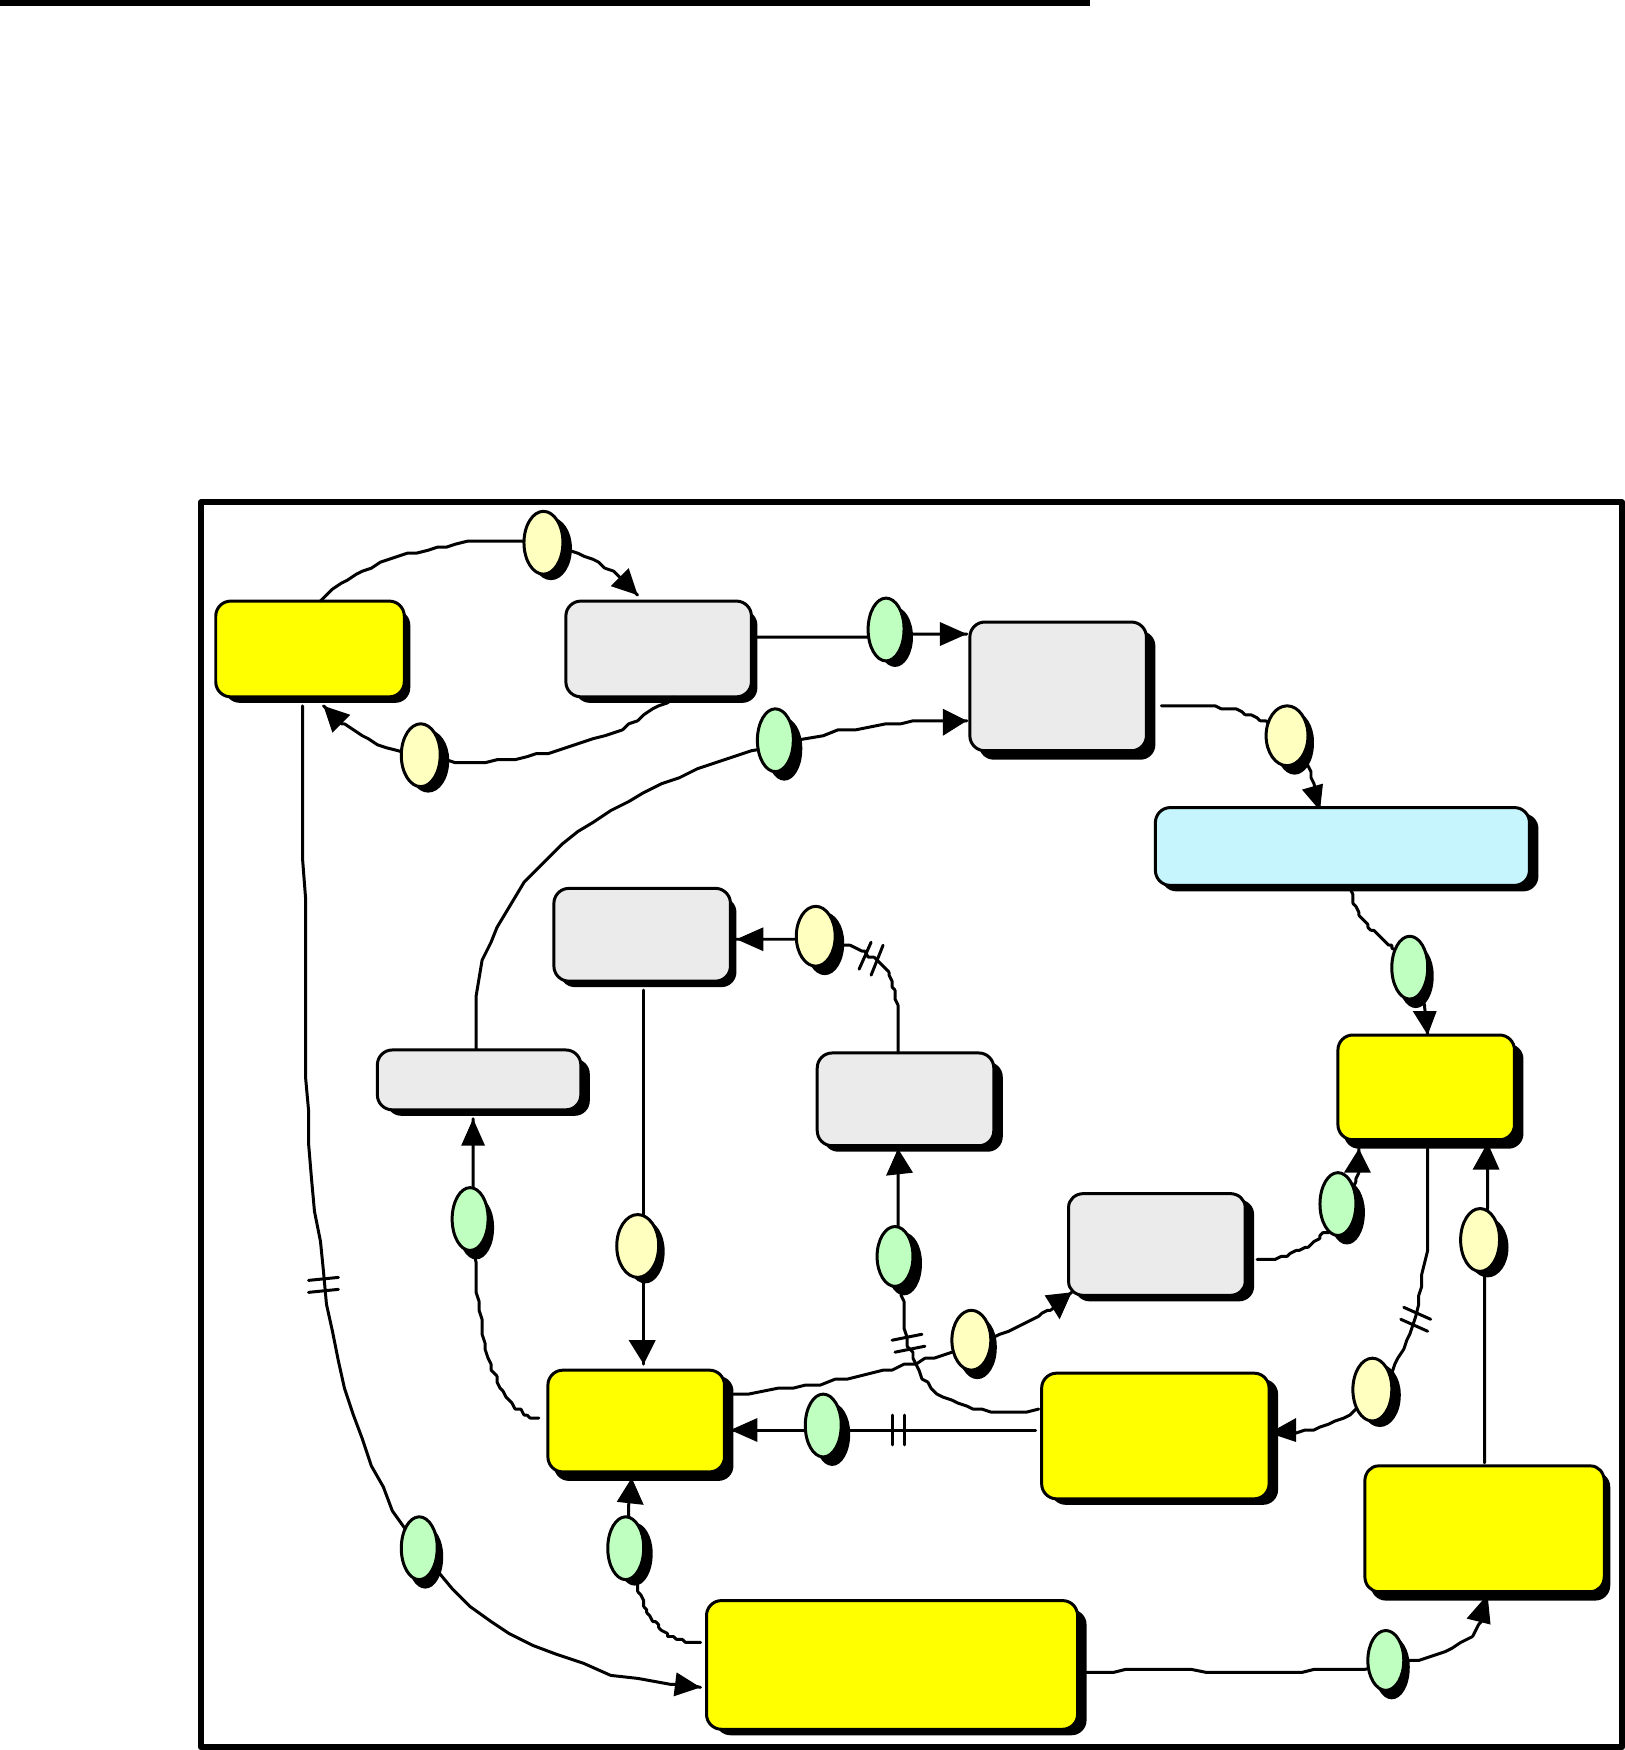
Figure 2 depicts the staffing module of the Resources Sector in the Dynamic BSC model.
This model tracks skill levels of senior executives, executives, technical and administrative
support staff, based on staff turnover rates and time at each level to reach full efficiency.
Figure 2: Staff Resources Segment of Dynamic Balanced Scorecard Model
At the moment this is a relatively simple model, but the intention is, at a later stage, to
incorporate the human capital accounting concepts of Paul Straussmann and Eric Sveiby.
Key resource management performance criteria relate to corporate governance (probity, fraud
control, etc), managing expenditure patterns (and especially employment related expenditure
patterns) to budget and achieving efficiencies in an increasingly efficient environment.
The Characteristics of the Internal Processes in the Federal Public Sector
The core processes in a Federal Department are essentially the same as for the private sector.
These are to:
• Establish direction;
• Acquire resources;
• Provide capability; and
• Execute the mission.
Whilst the Government establishes the policy and program outcomes that are to be achieved
in exchange for the financial resources, management translates the vision and allocates the
capabilities to achieve the delivery of agreed outputs.
The resource management framework provides a backdrop for an integrated planning process
that links corporate plans, business plans and individual plans. This planning process focuses
on achieving results through the delivery of outputs as the agency, the business unit and the
individual’s performance is linked to the outputs which in turn is linked to the outcomes that
the Government’s desires for the community. (Refer Annex 1).
As noted in relation to resource management, once the budget framework is set, Federal
Departmental managers have limited scope for obtaining extra resources. Any increase in
workload, or workload underestimate, typically will be addressed by working harder :
Personnel
Resources
Return To
Model
Sector
progress1
progress3 progress4
NovAttRate
SkilledAttRate
departing_
CompAttRate
progress2
TraiAttRate
hiring_SupStaff
Progress_delay Progress_delay Progress_delay Progress_delay Attriton_Rate
NoviceAttRate TrainAttRate_2 CompAttRate_1 SkilledAttRate_1
hiring_ExecStaff
Novice_ Trained_ Competent__ Skilled_ Experts
Support_Staff_Need
InitTrained
InitCompetent
InitSkilled InitExpertInitNovice
Executive_Staff_Need
! !
!
!
• more intense and longer hours of work (unpaid overtime)
• reduction in time devoted to training and development
• reduction in strategic management activities (through redirection of 'management
time' to 'task time')
• deferring some work (which simply postpones the day of reckoning) and
• reduction in target quality of inputs (e.g. through cutting background research effort)
or outputs
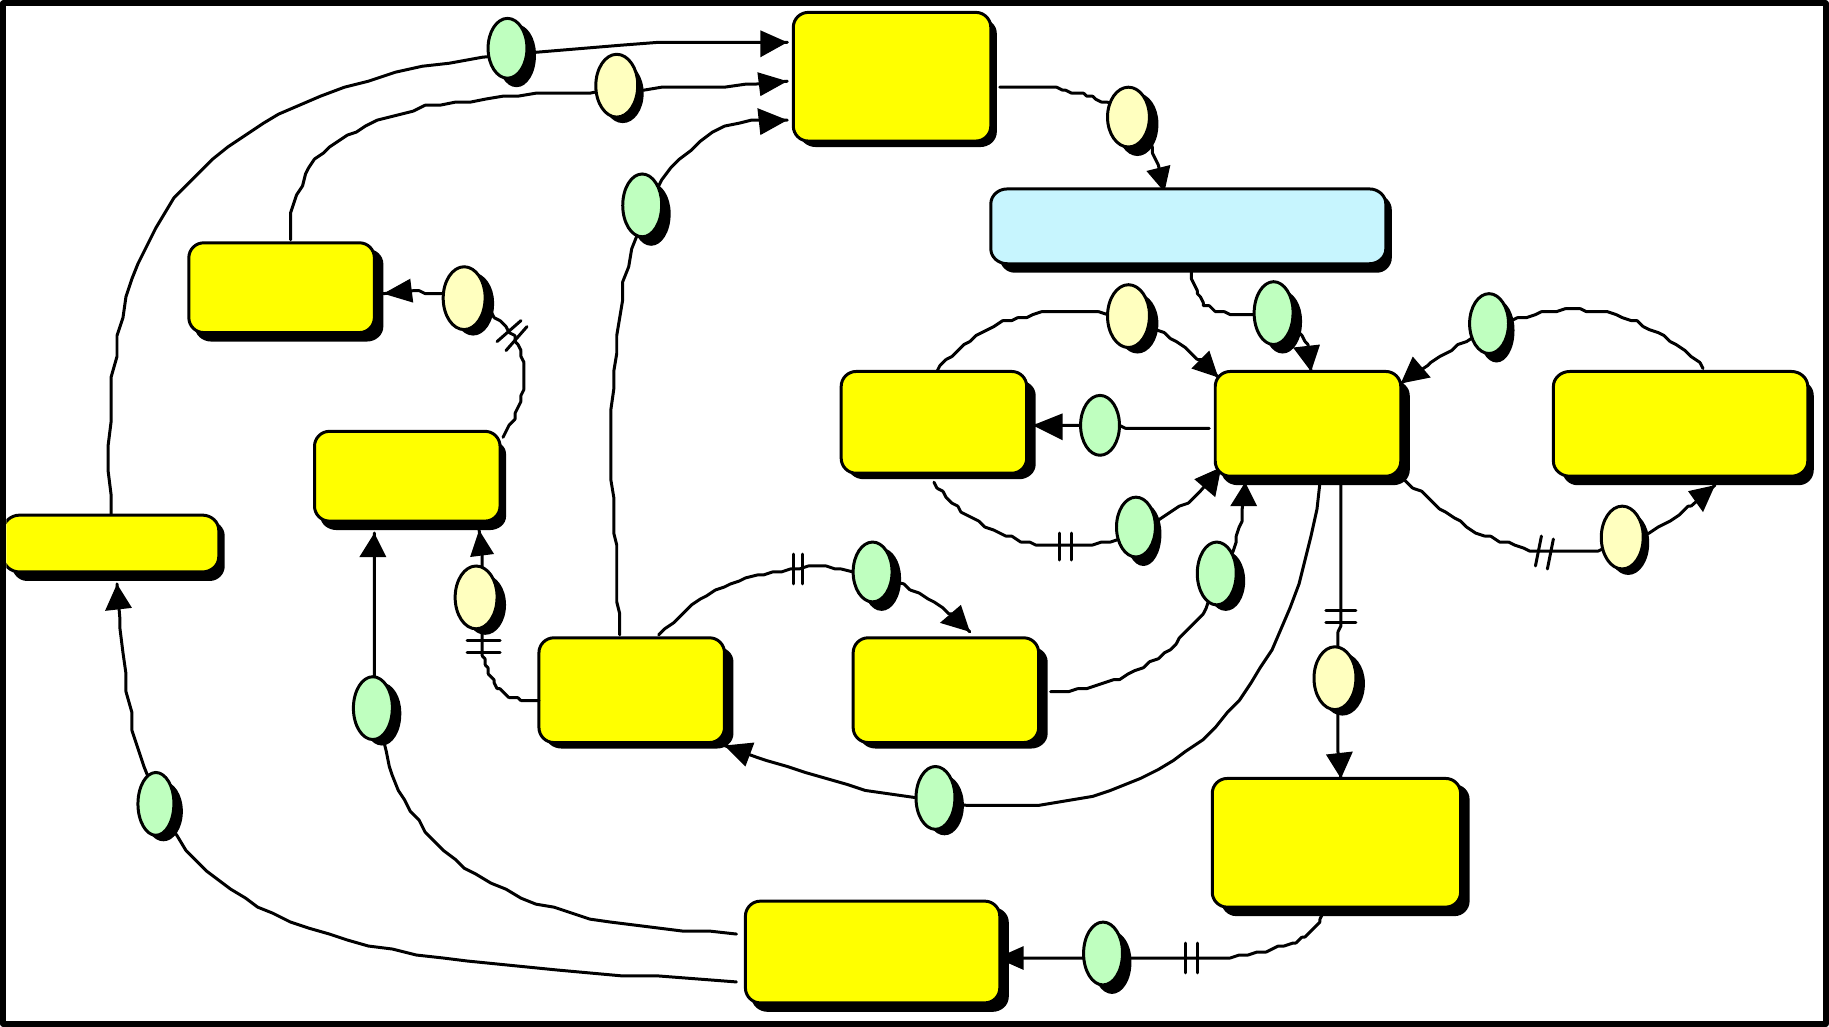
As illustrated in Figure 3, if such responses are prolonged, they tend to bring about
dysfunctional feedback effects which eventually increase the capacity gap, through increased
re-work, falling moral, increased staff turnover.
Where there is excellence in leadership and a culture characterised by the ‘learning
organisation’ one could expect innovative responses to any significant or prolonged ‘capacity
gap’. In essence such innovation changes the ‘rules of the game’ and achieves the end result
much more efficiently. There are many local examples of such behaviour across the
bureaucracy, but at this juncture the authors would be sparing in their application of ‘learning
organisation’ to Departments as a whole.
Only dysfunctional responses, as illustrated in Figure 3, have been incorporated in to the
model at this stage because of lack of data to permit modelling of the ‘learning organisation’
response.
Figure 3: Key Interrelationships Impacting on Internal Processes
Figure 4 is a simplified extract of the Powersim dynamic BSC model relating to the Internal
Process Sector, corresponding to the causal loop diagram above. The module currently draws
its base data from spreadsheet, including:
• annual work plans
• new policy and extra ministerial projects
Staff
Turnover
s
s
o
s
s
o
o
s
s
s
s
Work
Deferred
o
s
s
Time on
Strategic
Management
Work
Intensity
Total
Effective
Capacity
Re-work /
Errors
Average
Workload
CAPACITY GAP
s
o
Management
Effectiveness
Target Output
Quality
Staff
Morale
o
o
s
Productivity
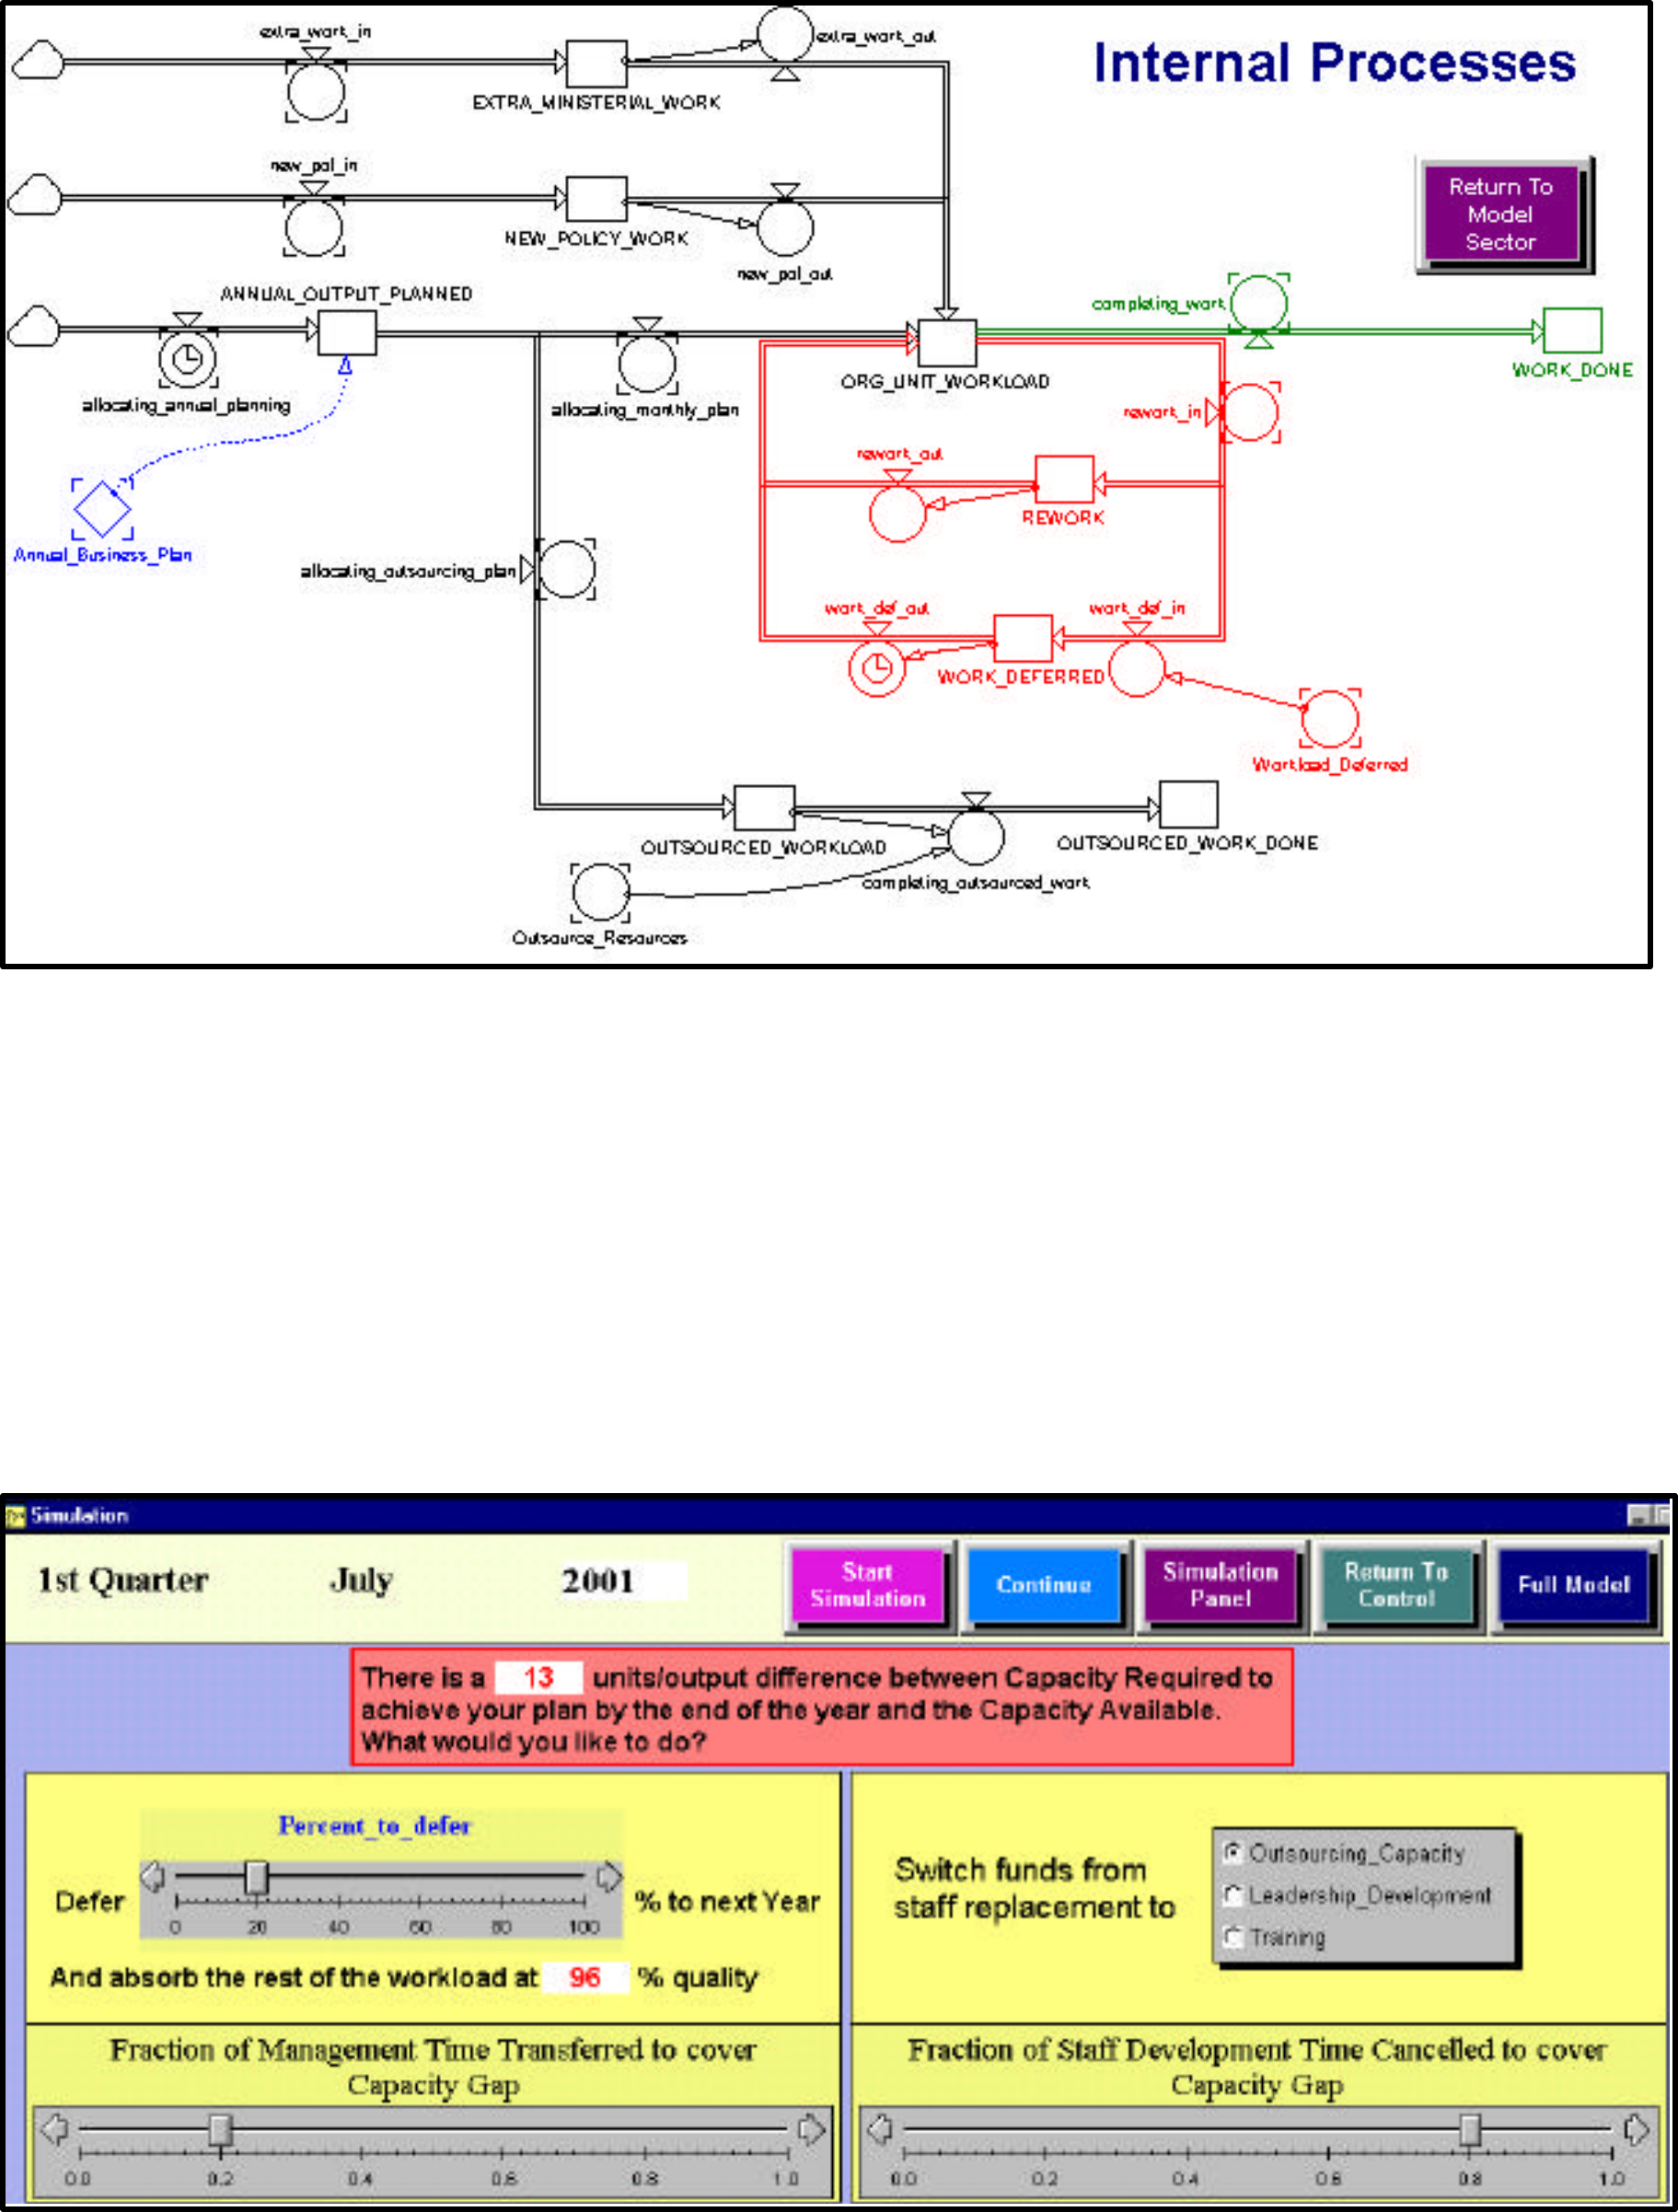
• average monthly patterns of work
The model also includes allows for outsourcing activities ( not included in the causal loop
diagram).
Figure 4: Internal Process Sector of the Dynamic BSC Model
In the model, how the capacity gap is addressed is a matter, each three months, for user
decision, with the user being given the choice of:
• specifying a % of the excess workload to defer to the next year
• switching a % of strategic management time onto the excess workload
• switching a % of staff development time on to the excess workload
• absorbing the excess workload through reduction in output quality
Figure 5: Dynamic BSC Simulator Control Panel
Innovation and Learning in the Federal Public Sector
Recruitment standards to the Australian Federal Public Service are high. Almost 50% of all
recruits have a Bachelor Degree or higher. Staff receive support to upgrade qualifications.
Middle & senior management training has a high priority. At the same time, work pressure
on all staff, and unpaid overtime, has increased significantly over the past 15 years. This acts
as an impediment to self-development. Also, in the face of work pressures, informal and
formal staff development tend to be among the first areas to be constrained. Figure 6 shows
the key causal relationships impacting on the learning and growth sector.
Figure 6: Key Interrelationships Impacting on Learning & Growth
In an increasingly competitive global environment, the Government’s vision for the public
service is one that has good leadership capabilities at all levels. In his address A High
Performance Public Service in August 1998, Dr David Kemp, Minister Assisting the Prime
Minister for the Public Service, stressed that strong leadership was critical to securing the
outcomes desired by Government. “Committed, robust public sector leadership is crucial to
making the most of the new framework for the Public Service. Success in this new
environment requires leaders who can establish a shared vision and sense of purpose, and
inspire, coach and enable their achievements”.
This leadership focus is important in considering the critical assumption in the model as it
now stands, that responses to a ‘capacity gap’ tend to be dysfunctional. The model, as it
stands, reflects the general experience across a wide range of Government Departments. The
case of the Federal Finance Ministry which had an average staff turnover at the executive and
senior executive levels of almost 30% per annum, and over 21% per annum across all staff,
over a 10 year period is perhaps the most striking. However, shining examples of innovative
‘Gordian Knot’ responses demonstrate the need for further research in this area.
Staff
Turnover
s
o
s
Total
Effective
Capacity
Average
Workload
CAPACITY GAP
Staff
Morale
o
Productivity
o
s
s
o
o
Skill
Level
Time for
Staff
Development
Capability
Investment
Innovative
Responses to
Gap
Learning Organisation
Competencies
s
s
s
Recurrent
Resources
o
o
s
s
o
s
Re-work /
Errors
Corporate Governance & Corporate Health
We have been undecided whether corporate governance and corporate health should be
regarded as sectors in their own right of the Federal Public Sector Balanced Scorecard. On
the one hand, Corporate Governance might be viewed as a key indicator in the Customer
Sector, whilst Corporate Health might be an indicator for the Internal Process Sector. On the
other hand, failures in these areas tend to have major political implications for the Minister
and the Government as well as significant feedback interrelationships with the other sectors.
This suggests that they might appropriately be considered as sectors in their own right. A
firm decision has yet to be made in this regard.
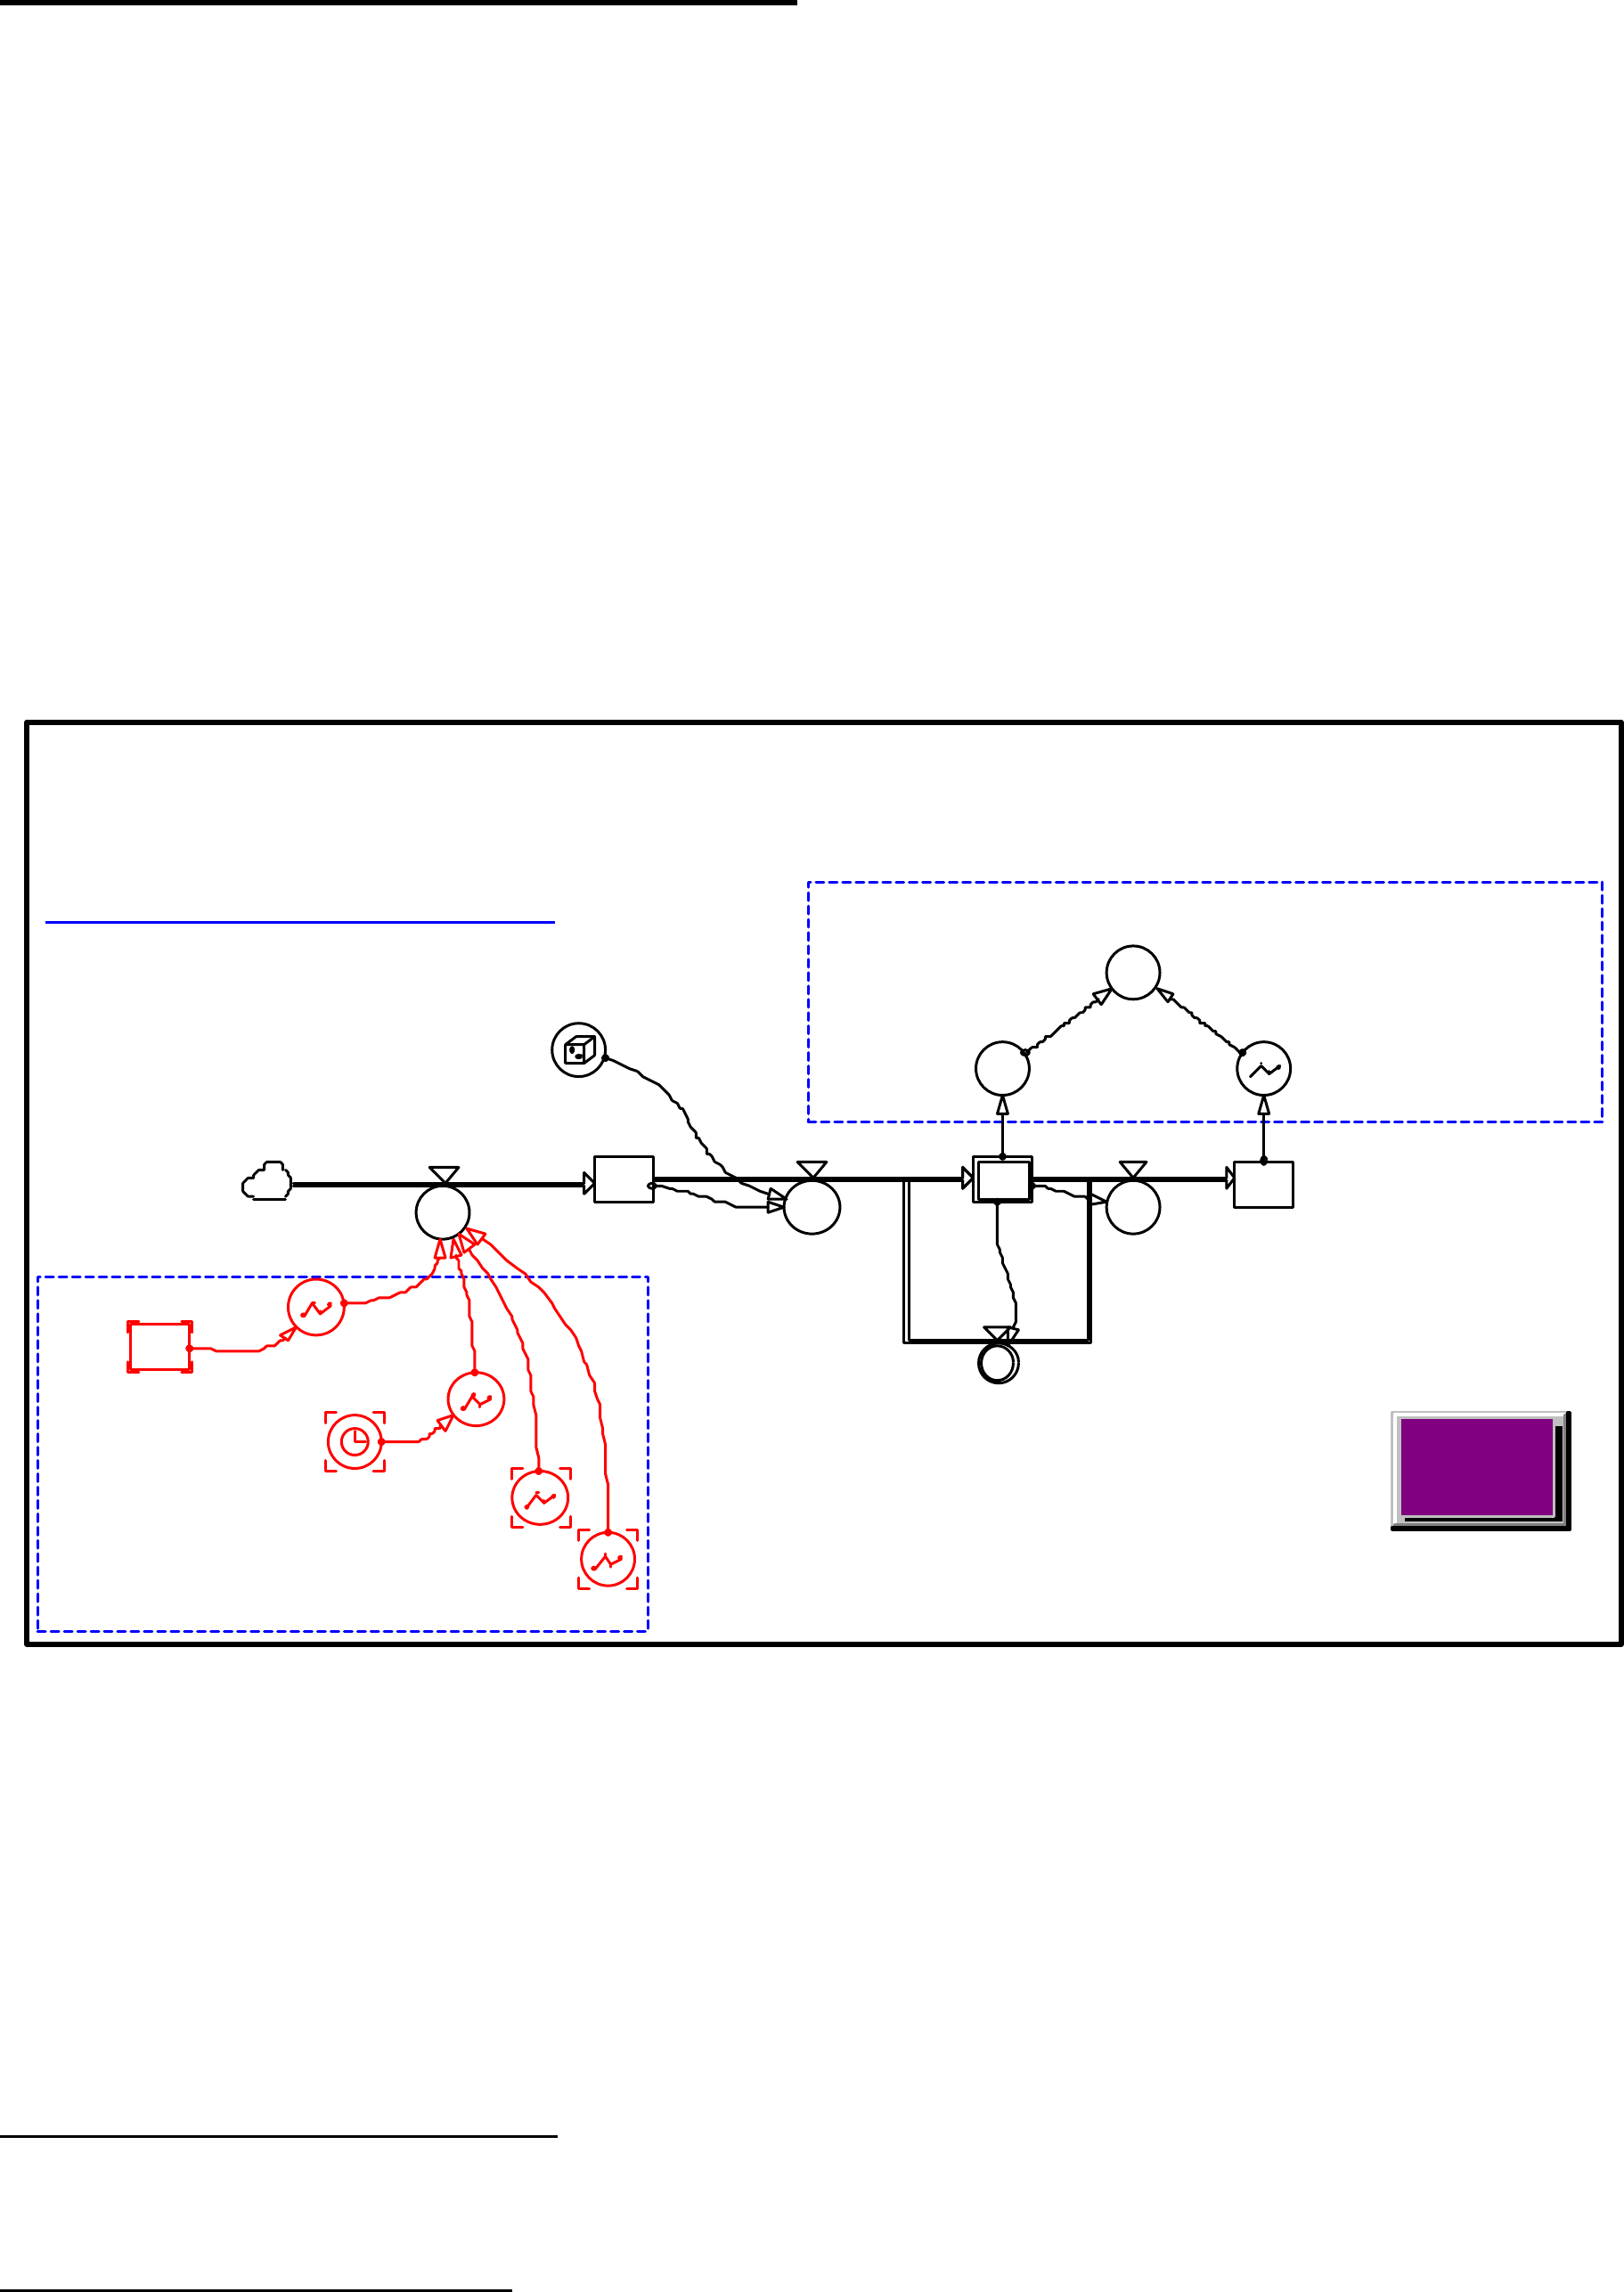
The Australian National Audit Office (ANAO) defines corporate governance to encompass
authority, accountability, stewardship, leadership, direction and control.
2
The dynamics BSC
model, at this stage, uses fraud events as a general surrogate for the effectiveness of
governance across the broad range of departmental activities.
Figure 7: Corporate Governance Sector of Dynamic Balanced Scorecard
Model Output
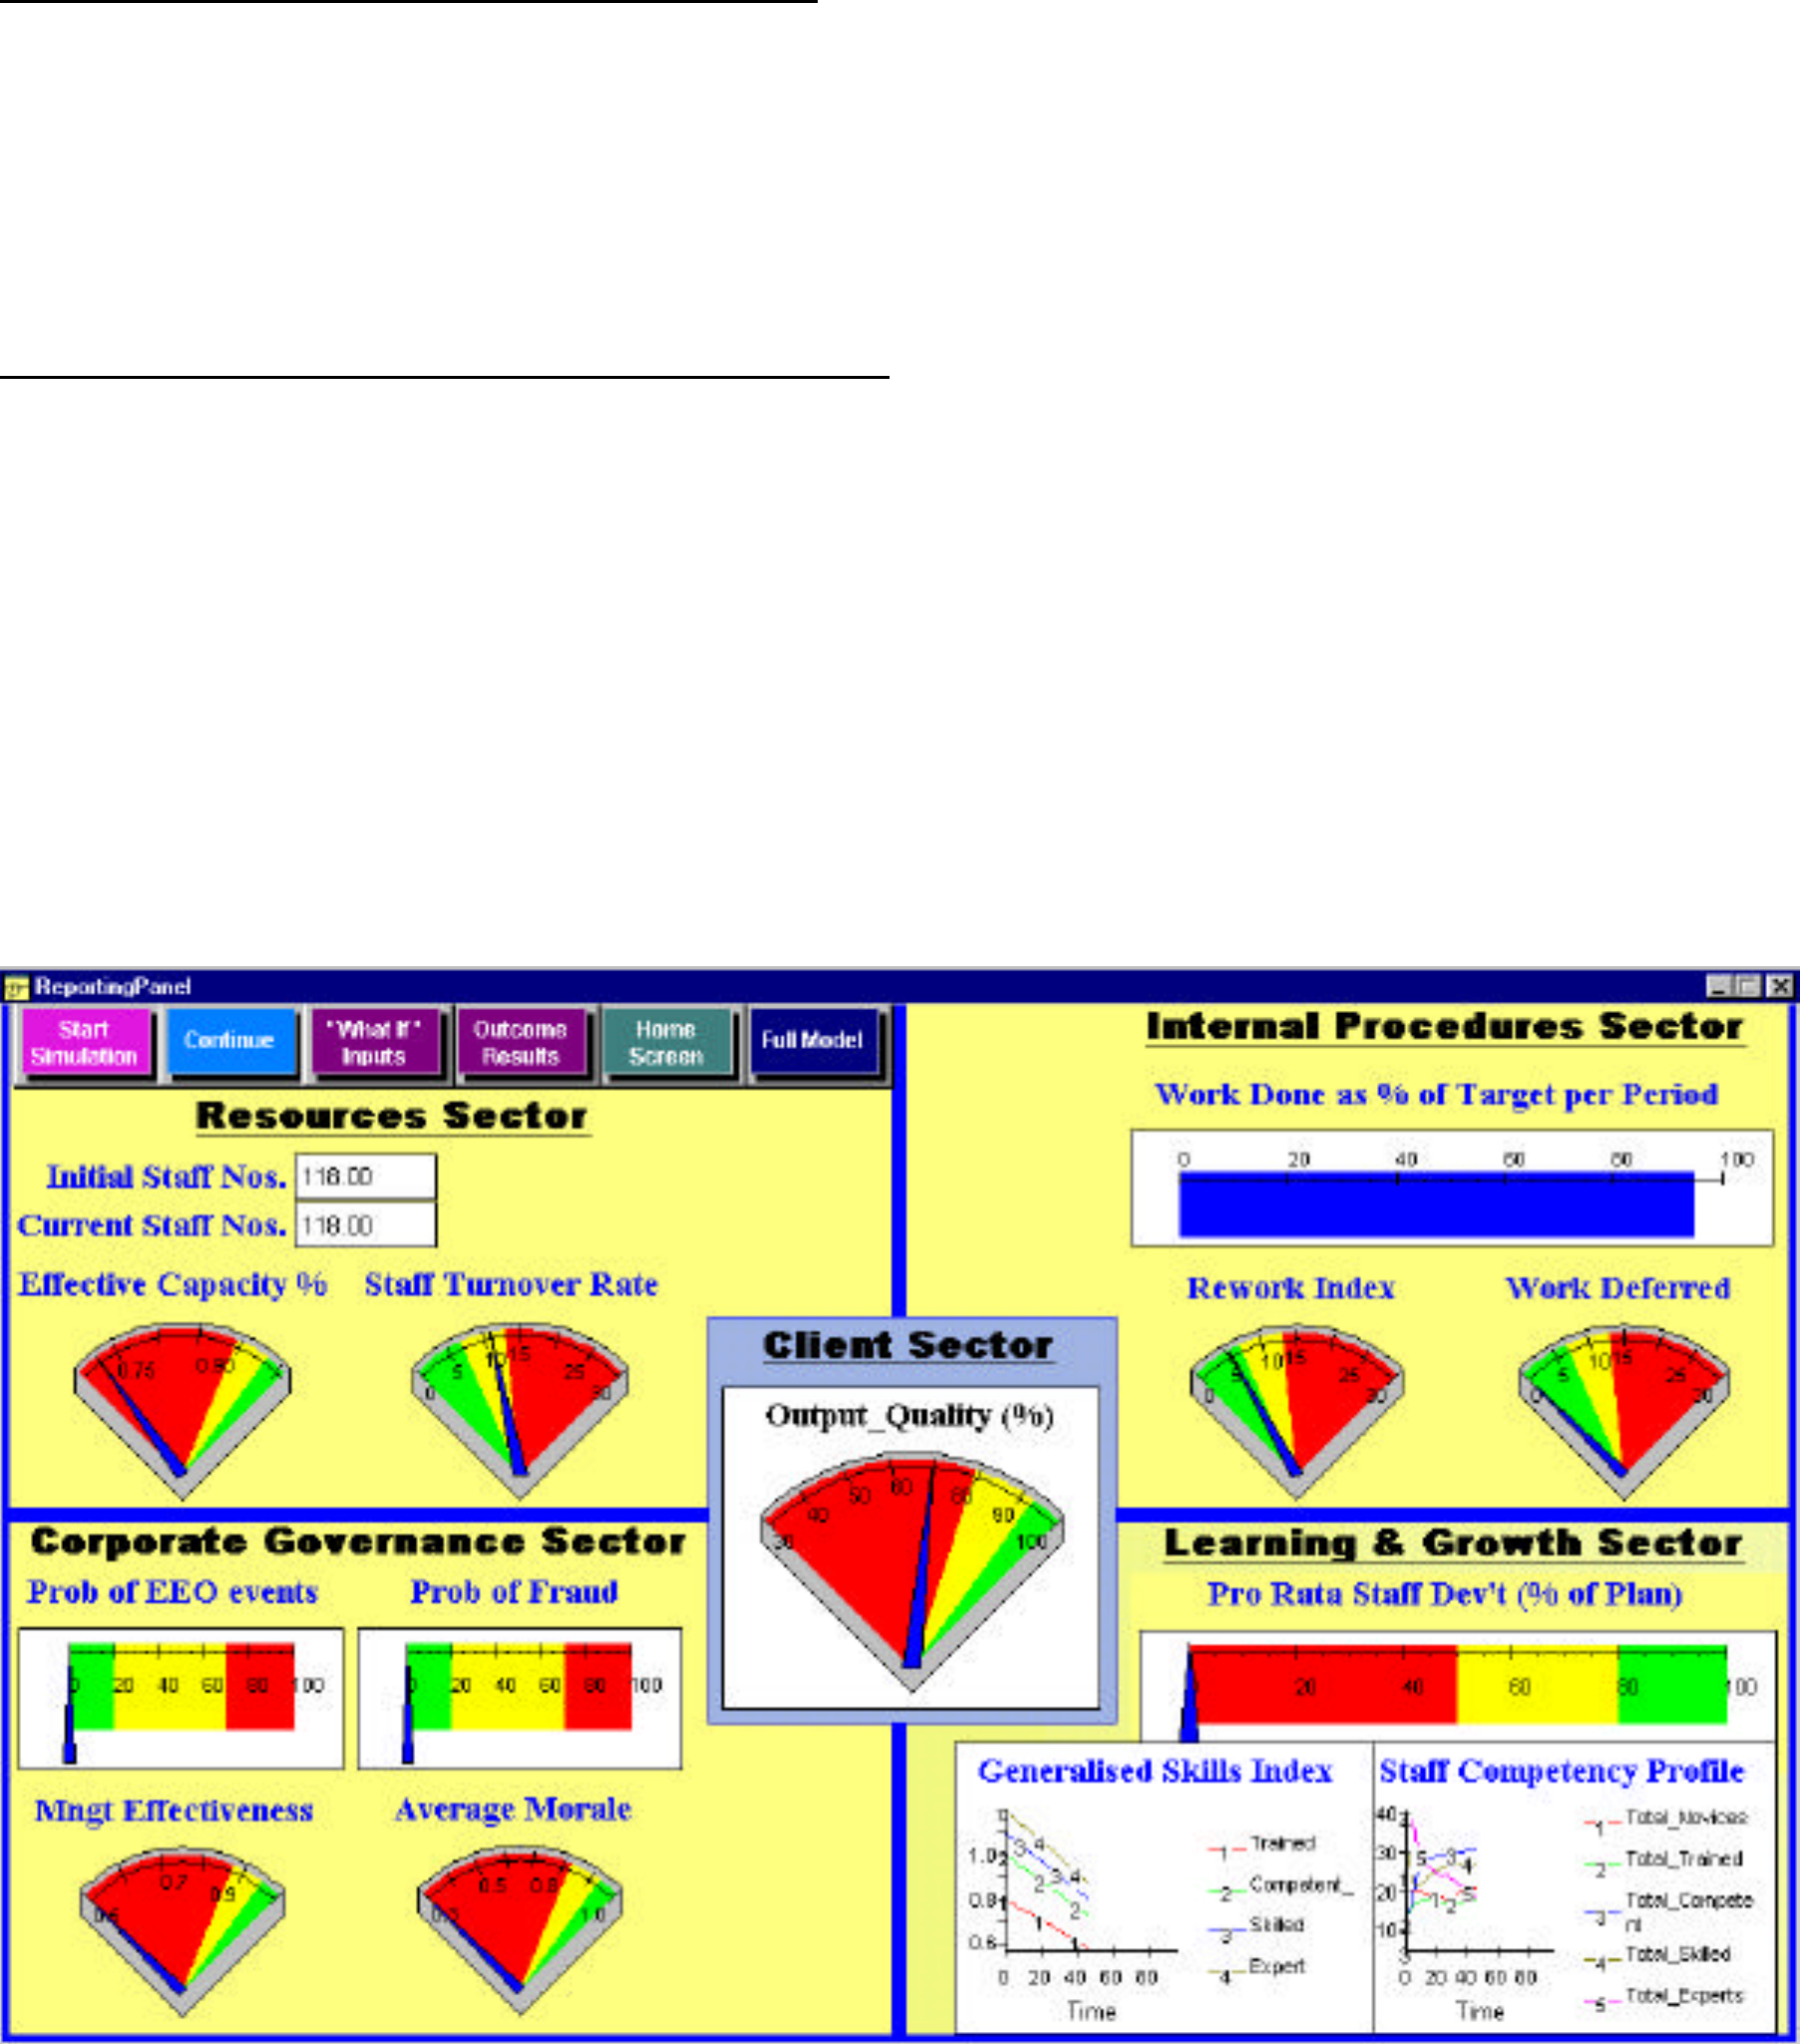
At the time of writing this paper, only illustrative reporting screens have been developed.
Figure 8 is an example. It is apparent from discussions with departmental staff that ultimate
use of the simulator will depend as much as anything on the “look and feel” of the output
screens. The current version of Powersim has limited flexibility in screen design and it is
likely that custom screens will be developed in Visual Basic or C++.
Future Developments
Model Validation & Verification
Whilst basic validation has been carried out during model construction, a wide range of
parameter values at this stage are simply based on the judgement of experienced public
2
ANAO, Applying the Principles and Practice of Corporate Governance in Budget Funded Agencies, Australian
Government Publishing Service, Canberra 1997.
Corporate Governance Sector
Fraudulent and Dubious Practices
Public Awareness of Fraud
Return To
Model
Sector
Internal Factors Impacting on Fraud
Fraud_Accumulating
in_progress
Fraud_occuring
Random_Num
FRAUD_TOTAL
FRAUD_EVENTPROBABILITY_OF_FRAUD
Fraud_Events_MAvg
Public_Awareness_of_Fraud
Effect_of_Fraud_Total_on_Awareness
Effect_of_Fraud_Total_on_Awareness
Management_Effectivness
Effect_of_Morale_on_Fraud
MORALE
Effect_of_StaffDevelopment_on_Fraud
StaffDevelopment_Index
Increase_in_Fraud_Prob
! !!!
service officials. Analyses will be undertaken to identify the model’s sensitivity to such
parameters and the more significant ones will be subject to more detailed research. At the
same time a very wide range of management literature is being reviewed to provide as much
support as possible for the key relationships.
Integration With Departmental Work Plans
The next stage of the project will involve a detailed strategic planning session with senior
managers to identify branch activities, outputs and performance indicators. The template at
Annex 1 was developed to guide discussion. Following this a high level model will be
developed relating the work inputs and key output indicators. This would then be integrated
with the output quality driver from this model.
Integration With Balanced Scorecard Software
The final stage of this project will be to link the dynamic simulator with the Department’s
proposed enterprise information system. At this stage no firm decision on the software has
been made : contenders include SAP, PeopleSoft and CorVu. The model design is such that it
should be relatively straight forward to draw base data directly from the corporate system.
____________________________________________
Figure 8: Illustrative Output Screen for the Dynamic Balanced Scorecard

ANNEX A: 2000-01 Business Planning Development Template
OUTCOMES CONTRIBUTING TO STRATEGIC DIRECTION:
Include those outcomes that the business unit contributes to: eg.
Outcome 1 – A cultural environment that enriches the lives of all Australians)
Outcomes 2 – A competitive and diverse communications and information technology
industries and services
OUTPUTS CONTRIBUTING TO OUTCOMES:
Outcome 1
Include those outputs that the business unit contributes to outcome 1 eg.
Output 1.1 - Advice on the policy and regulatory framework for cultural heritage
Output 1.2 - Programs which support national organisations of cultural excellence
Outcome 2
Include those outputs that the business unit contributes to outcome 2
Output 2.1 – Advice on the policy and regulatory framework for communications industries
Output 2.4 – Administer departmental programs to promote access to communication services
OUTPUT 1.1
STRATEGIC
OBJECTIVE
KEY
STAKEHOLDER
CORE
PROCESS
PROJECT
/ ISSUE
ACTION
ITEM
LINKAGE TO
OTHER
BUSINESS UNIT/S
PERFORMANCE MEASURES 1.1
QUALITY QUANTITY TIMLINESS COST PRICE STAFF
YEARS
RESOURCES FOR OUTCOME 1:
DEPARTMENTAL EXPENSES OUTPUT 1
($’000)
OUTPUT 2
($’000)
Total for outcome
1 ($’000)
Employee expenses
Supplier expenses
Other operating expenses
Capital expenses
Own sourced revenue
Administered Expenses:
Subsidies
Grants
Other
Independent revenues/other revenues