Fillable Printable Sample Financial Plan
Fillable Printable Sample Financial Plan

Sample Financial Plan

Sample Financial Plan
For more information, please call:
John Jones
Wealth Advisor
ScotiaMcLeod
715 Hewitson St.
Thunder Bay. Ontario
P7B 6B5
John and Mary Smith
June 19, 2009

Table of Contents
Disclaimer........................................................................................................................ 3
Introduction...................................................................................................................... 4
Net Worth ........................................................................................................................ 5
Cash Flow ...................................................................................................................... .6
Asset Allocation............................................................................................................... 7
Retirement....................................................................................................................... 9
Life Insurance - John..................................................................................................... 13
Life Insurance - Mary..................................................................................................... 15
Life Insurance - John and Mary..................................................................................... 17
Estate Summary............................................................................................................ 19
Conclusion..................................................................................................................... 20
Appendix - Plan Data Summary.................................................................................... 21

Important: The projections or other information generated by NaviPlan® version 11.0 regarding the likelihood of various
investment outcomes are hypothetical in nature, do not reflect actual investment results, and are not guarantees of future
results. The projections utilize return data that do not include fees or operating expenses, are not available for
investment, and are shown for illustrative purposes only. If included, fees and other operating expenses would materially
reduce these projections. See the Disclaimers section at the beginning of this document for more information.
Page 3 of 26
Disclaimer
This financial plan is hypothetical in nature and is intended to help you in making decisions on your financial
future based on information that you have provided and re viewed.
IMPORTANT: The projections or other information generated by NaviPlan® regarding the likelihood
of various investment outcomes are hypothetical in nature, do not reflect actual investment results,
and are not guarantees of future results.
Criteria, Assumptions, Methodology, and Limitations of Plan
The assumptions used in this financial plan are based on inform ation provided and reviewed by you. Please
review all assumptions in the Appendix - Plan Data Summary section before reviewing the rest of the report
to ensure the accuracy and reasonable ness of the assumptions. Those assumptions must be reconsidered
on a frequent basis to ensure the results are adjusted accordingly. The smallest of changes in assumptions
can have a dramatic impact on the outcome of this financial plan. Any inaccurate represent ation by you of
any facts or assumptions used in this financial plan invalidates the results.
We have made no attempt to review your property and liability insurance policies (auto and homeowners, for
example). We strongly recommend that in conjunction with this financial plan, you consult with your property
and liability agent to review your current coverage to ensure it continues to be appropriate. In doing so, you
may wish to review the dollar amount of your coverage, the deductibles, the liability coverage (including an
umbrella policy), and the premium amounts.
This plan does not constitute advice in the areas of legal, accounting or tax. It is your responsibility to
consult with the appropriate professionals in those areas either independently or in conjunction with this
planning process.
Results May Vary With Each Use and Over Time
The results presented in this financial plan are not predictions of actual results. Actual results may vary to a
material degree due to ext ernal factors beyond the scope and control of this financial plan. Historical data is
used to produce future assumptions used in the financial plan, such as rates of return. Past performance is
not a guarantee or predictor of future performance.
The results are based on your representation of risk and include information current as of March 13, 2009.
You are responsible for confirming that the answers you provided to determine your individual risk tolerance
used in this financial plan are accurately represente d. The proposed asset allocation presented in this plan
is based on your answers to a risk tolerance questionnaire and may represent a more aggressive and
therefore more risky investment strategy than your current allocation mix. Actual return rates and
performance may vary to a significant degr ee from that represented in this plan.
Investments Considered
This plan does not consider the selection of individual securities; the plan provides model portfolios. The
results contained herein do not constitute an actual offer to buy, sell or recommend a particular investment
or product. All investments are inherently risky. The asset classes and return rates used in the plan are
broad in nature. The illustrations are not indicative of the future performance of actual investments, which
will fluctuate over time and may lose value. Refer to the Asset Allocation section of this report for details on
return rate assumptions used throughout this plan.
There are risks associated with investing, including the risk of losing a portion or all of your initial investment.

Important: The projections or other information generated by NaviPlan® version 11.0 regarding the likelihood of various
investment outcomes are hypothetical in nature, do not reflect actual investment results, and are not guarantees of future
results. The projections utilize return data that do not include fees or operating expenses, are not available for
investment, and are shown for illustrative purposes only. If included, fees and other operating expenses would materially
reduce these projections. See the Disclaimers section at the beginning of this document for more information.
Page 4 of 26
Introduction
Why devel op a pla n?
By developing a financial plan, you an d your family:
• Will have a better understanding of your current financial situation.
• Determine attainable retir ement, educati on, insurance, and other financial goals.
• Review goals, funding strategies, and alternatives where goals have to be compromised.
• Have the necessary financial resources set aside to fund your goals as they occur.
• Reduce the effect of unexpected events, such as disability, premature death, etc.
Planning is a life-long journey.
For the planning process to evolve successfully, changing circumstances or lifestage requirements must be
factored in. Your Scotiabank advisor will want to know when personal or financial events occur, anticipated
or not, to clarify whether your goals are affected and if there are new decisions needed.
When do we revie w the pla n?
While simply having a plan in place will give you a better understanding of your financial situation, regularly
reviewed and updated, th e likelihood of achieving the desired results is gr eatly enhanced. Some of the
events for which you may need to review your strategies are: changes in your career status, marital
situation, and the well-being of your lo ved ones.

Important: The projections or other information generated by NaviPlan® version 11.0 regarding the likelihood of various
investment outcomes are hypothetical in nature, do not reflect actual investment results, and are not guarantees of future
results. The projections utilize return data that do not include fees or operating expenses, are not available for
investment, and are shown for illustrative purposes only. If included, fees and other operating expenses would materially
reduce these projections. See the Disclaimers section at the beginning of this document for more information.
Page 5 of 26
Net Worth
This net worth summary provides a snap shot showing a financial situation at a certain point in time. It
includes what you own (a ssets), what you owe to creditors (liabi lities), and the net value or difference
between the two (net worth). In simple terms, the net worth statement shows how much money would be left
if everything you owned w as converted into cash and used to pay off your debts (before taxes).
The following information is a description of items likely to appear in the report below. Your report may
contain some or all of the items listed:
• Lifestyle assets include your home, vacation homes and collectibles.
• Non-Registered assets include stocks, bonds, mutual funds and cash.
• Registered assets include your registered and locked-in retirement plans, such as RRSPs, RRIFs, LIFs
and LRIFs.
• Liabilities include your mo rtgages, loans, personal lines of credits and credit cards.
• Cash Flow Surplus is the amount of surplus funds from your cash flow statement. In other words,
income you did not spend which may be represent ative of your checking account, for instance.
Net Worth Summary
As of March 13, 2009
John Mary Joint Total
Non-Reg istered Investments
Investment Portfolios 125,897 125,897
Register ed Investmen t s
RRSPs / Spousal RRSPs 35,986 126,789 162,775
RPP - money purchase 106,898 106,898
Lifestyle Assets (residences, etc.)
450,000 450,000
Life Insu ran ce Cash Value
Liabilities
(98,786) (98,786)
Total Net Worth 142,884 126,789 477,111 746,784

Important: The projections or other information generated by NaviPlan® version 11.0 regarding the likelihood of various
investment outcomes are hypothetical in nature, do not reflect actual investment results, and are not guarantees of future
results. The projections utilize return data that do not include fees or operating expenses, are not available for
investment, and are shown for illustrative purposes only. If included, fees and other operating expenses would materially
reduce these projections. See the Disclaimers section at the beginning of this document for more information.
Page 6 of 26
Cash Flow
The cash flow report below outlines your current sources of income and expenses. Your income includes
employment income, investment income and any other sources. Your expenses include your daily living
expenses, debt payment s including your mortgage, current investment contributions and insurance
premiums.
Current Surplus/(Deficit) displays any excess cash available or shortfall at the end of the current year once
all expenses have been covered an d investments made. Ending Surplus/(Deficit) displays the final surplus
or deficit at the end of the current year after adjustments to or from other family members. The family’s
ending surplus or deficit is the sum of the individual family member’s ending surpluses or deficits.
John Mary Family
Cash Inflows
Employment Inflows $82,000 $64,000 $146,000
Investment Inflows $3,263 $2,334 $5,597
Total Cash Inflows
$85,263 $66,334 $151,597
Cash Outflows
Lifestyle Expenses $52,152 $44,831 $96,983
Taxes $24,571 $15,472 $40,043
Employment/Business Expenses $732 $732 $1,465
Miscellaneous Expenses $929 $0 $929
Non-Registered Contributions and Reinvestments $1,483 $1,483 $2,966
Registered Contributions $5,396 $3,816 $9,212
Total Cash Outflows
$85,263 $66,334 $151,597
Current Surplus/(Deficit)
0
Ending Surplus/(Deficit)
0
Important: The projections or other information generated by NaviPlan® version 11.0 regarding the likelihood of various
investment outcomes are hypothetical in nature, do not reflect actual investment results, and are not guarantees of future
results. The projections utilize return data that do not include fees or operating expenses, are not available for
investment, and are shown for illustrative purposes only. If included, fees and other operating expenses would materially
reduce these projections. See the Disclaimers section at the beginning of this document for more information.
Page 7 of 26
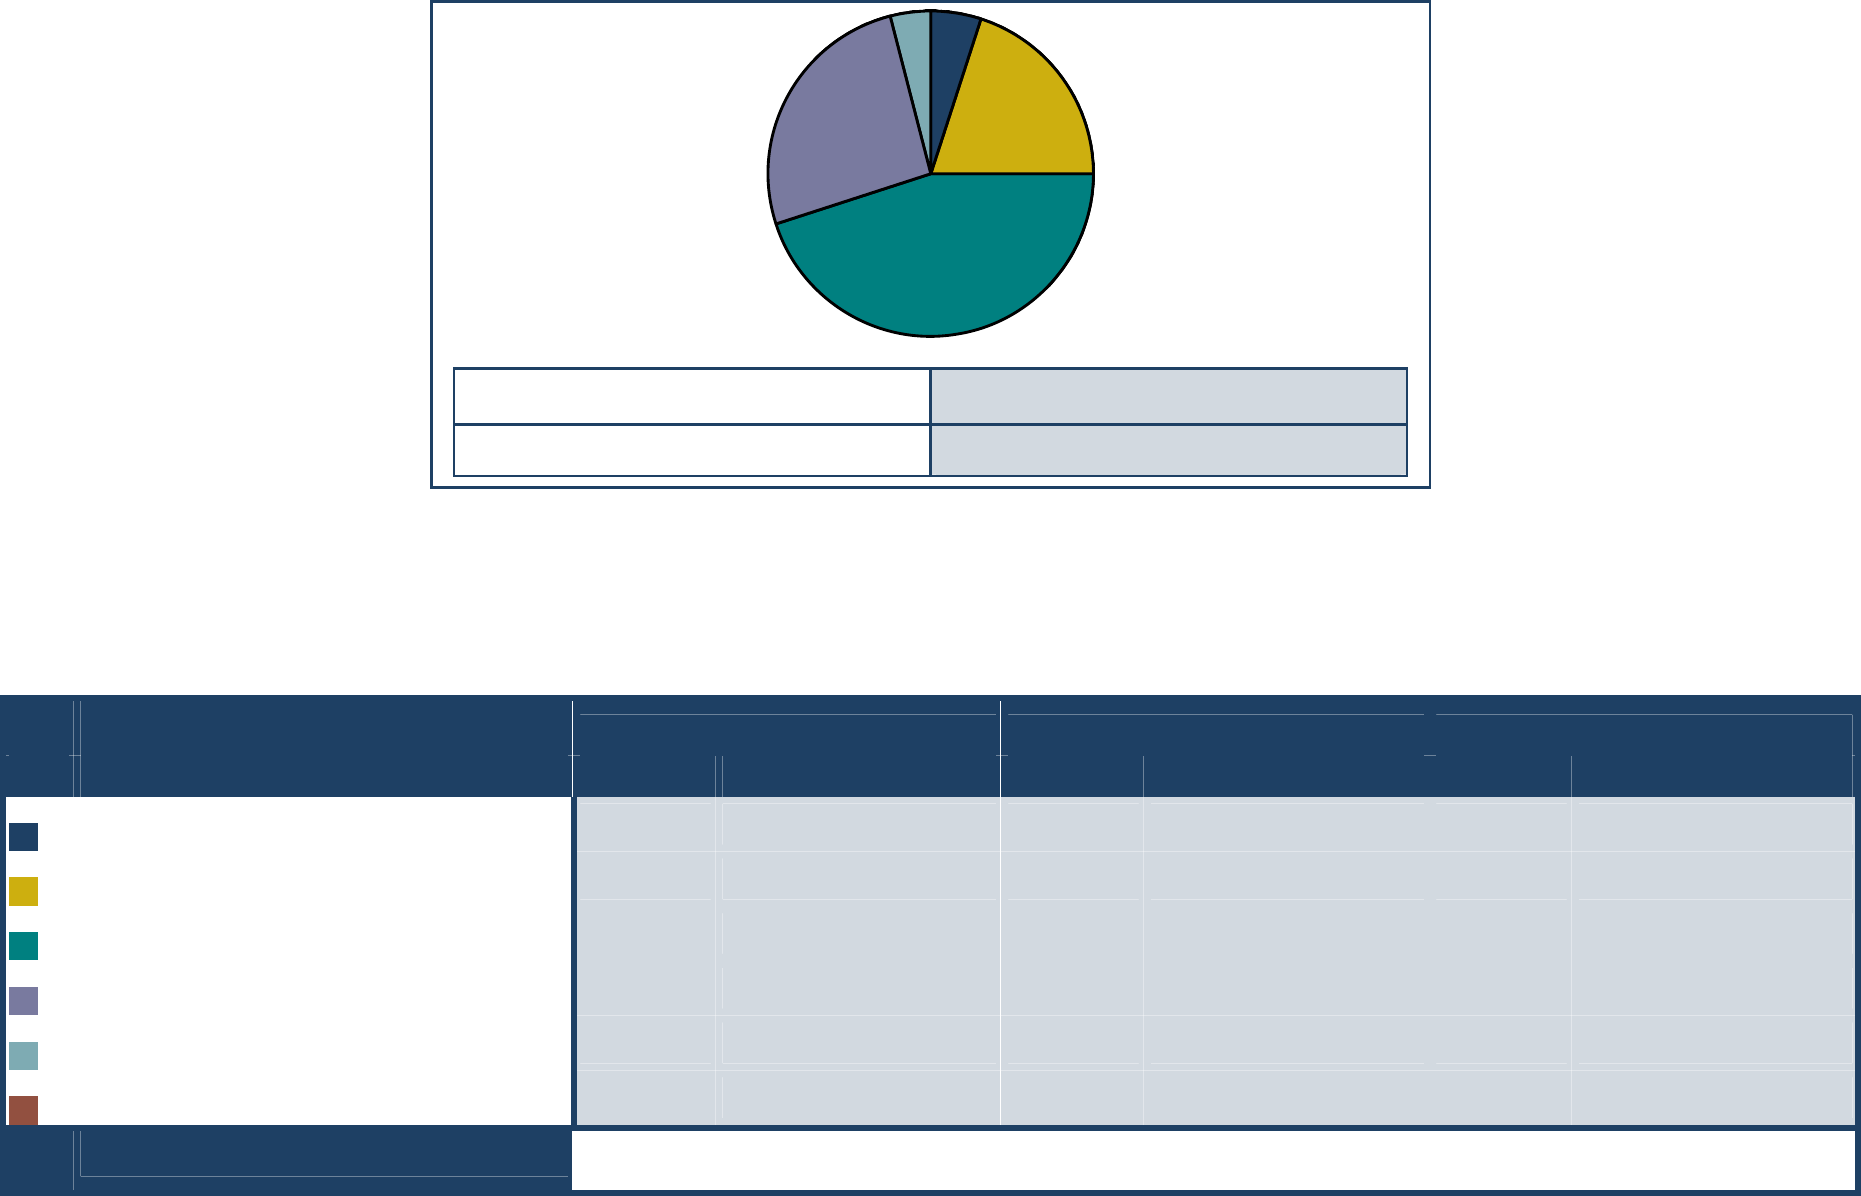
Asset Allocation
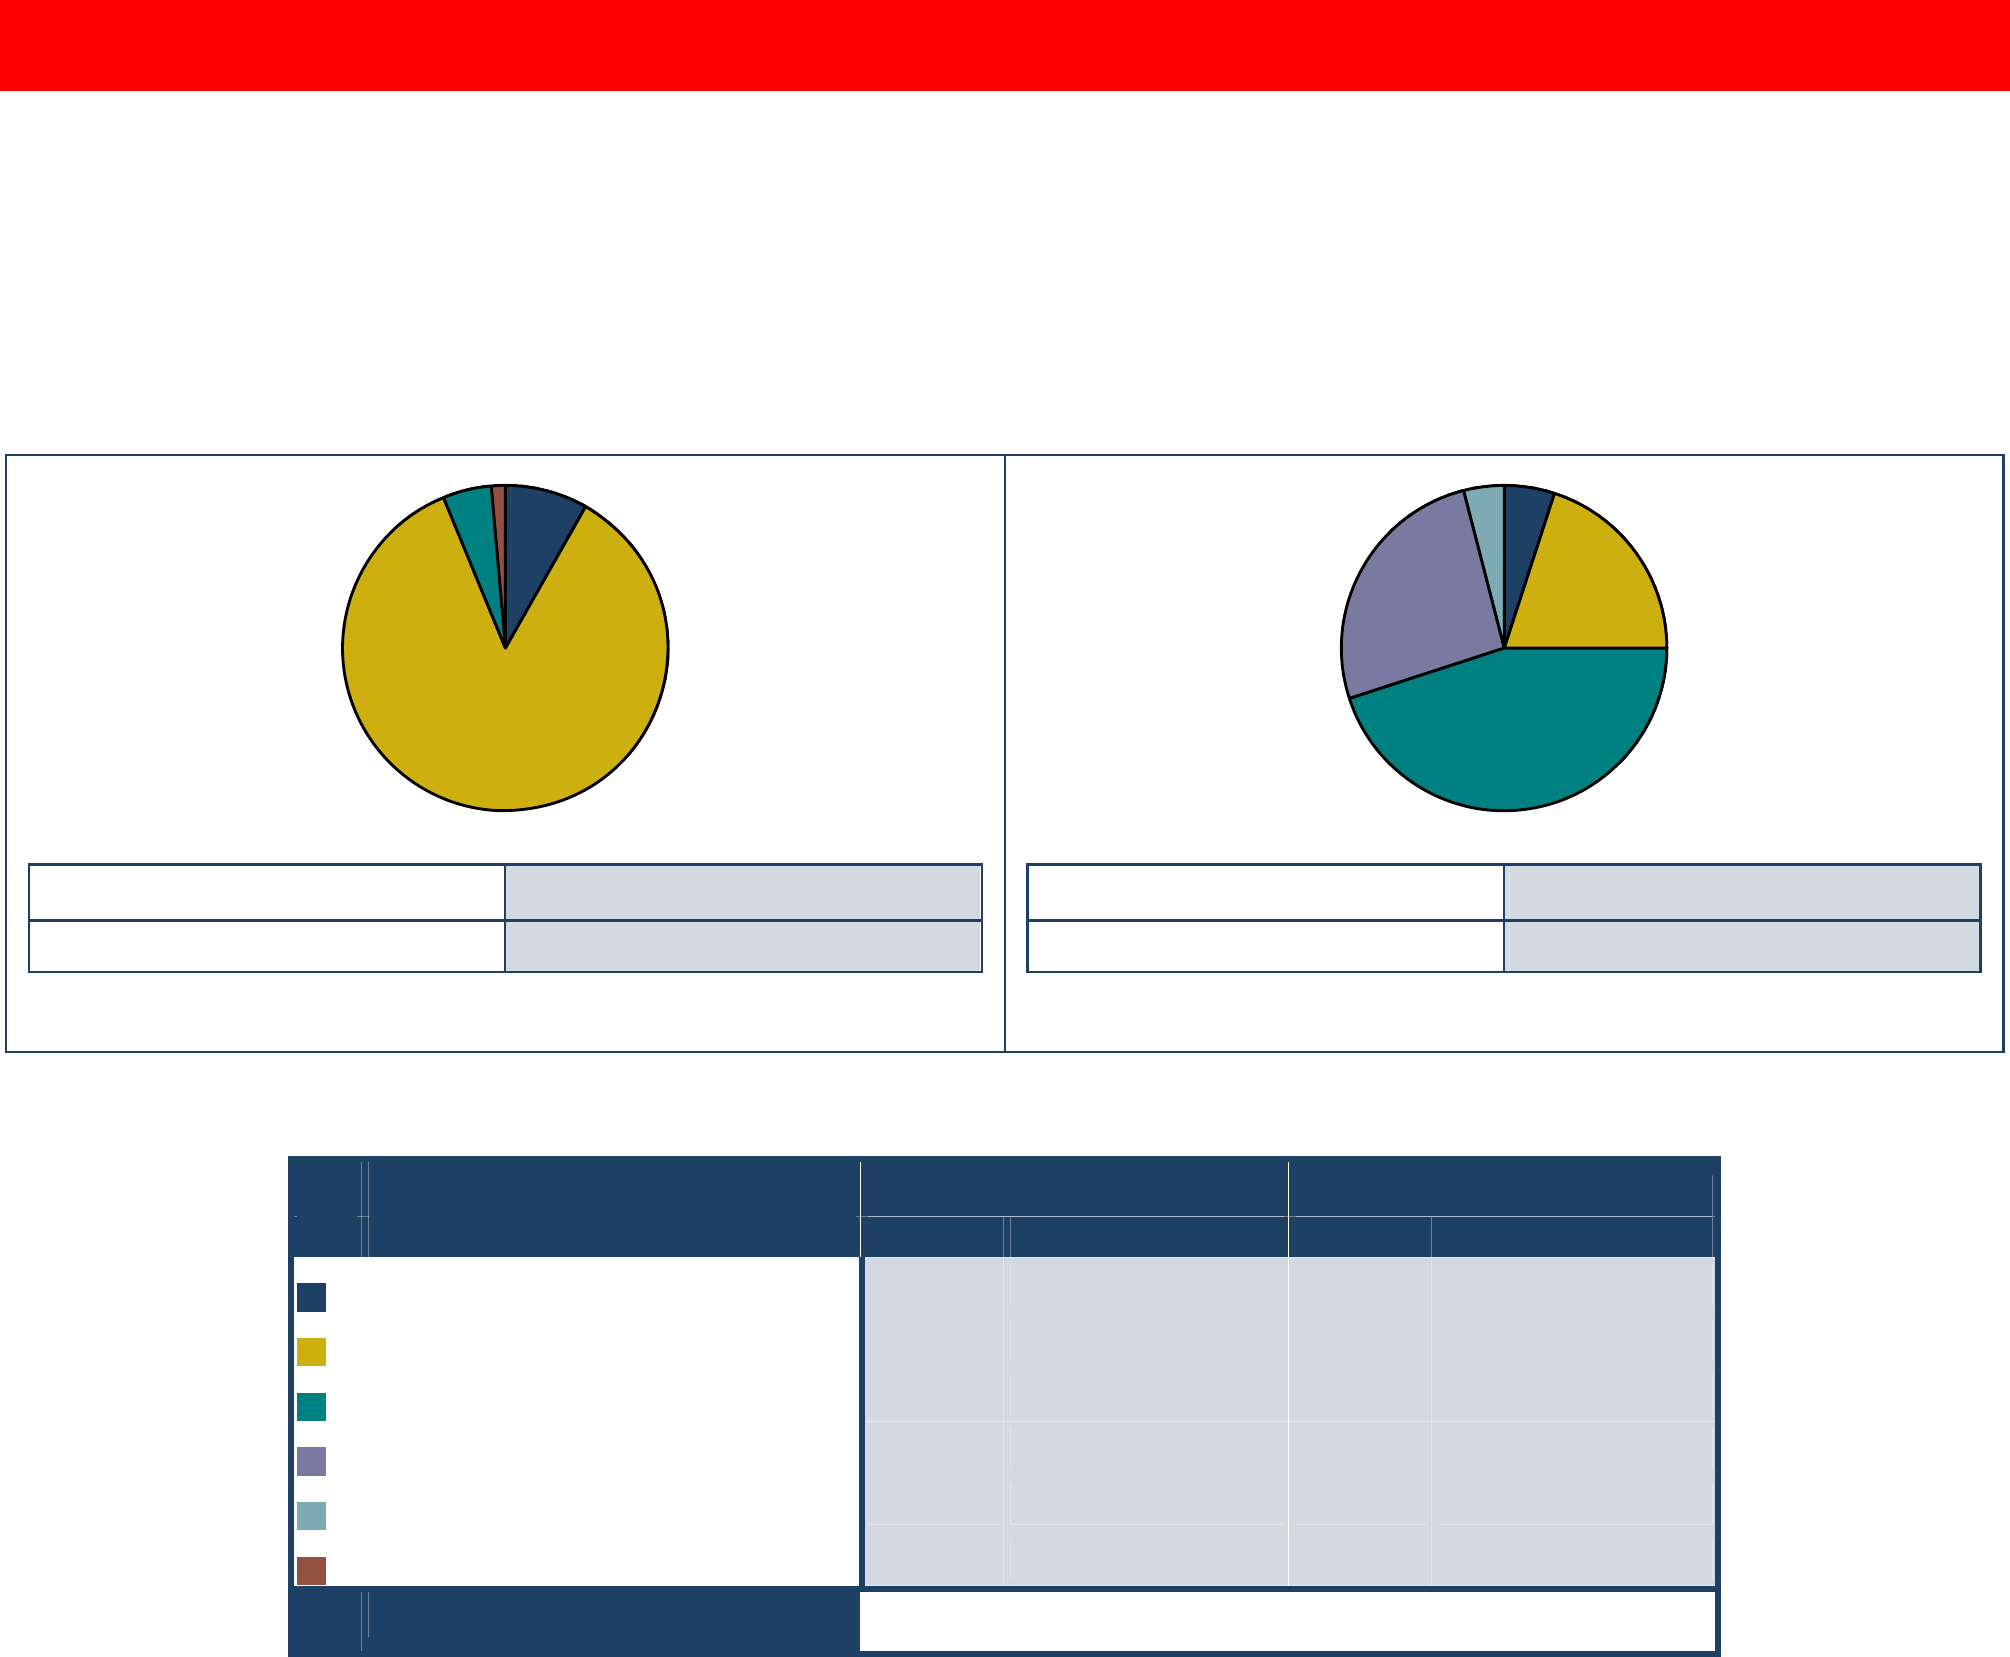
These pie graphs illustrate your current asset mix and suggested asset mix for your entire portfolio.
However, the suggested asset mix will not be used in the proposed plan. Due to modifications the assumed
asset mix on the following page will be used instead.
Current Asset Mix Suggested Asset Mix*
Cons Growth
Rate of Return
4.98%
Standard Devi ation 0.00%
Rate of Return
7.15%
Standard Devi ation 0.00%
*Modifications have been made to the suggested asset mix.
Current Asset Mix Suggested Asset Mix
Asset Class (%) ($) (%) ($)
Cash
8.2 32,377 5.0 19,779
Fixed In come
85.6 338,911 20.0 79,114
Canadian Equity
4.8 18,885 45.0 178,007
US Equity
26.0 102,848
Internationa l Equity
4.0 15,823
Preferreds
1.4 5,398
Total
100.0
395,570
100.0
395,570
Important: The projections or other information generated by NaviPlan® version 11.0 regarding the likelihood of various
investment outcomes are hypothetical in nature, do not reflect actual investment results, and are not guarantees of future
results. The projections utilize return data that do not include fees or operating expenses, are not available for
investment, and are shown for illustrative purposes only. If included, fees and other operating expenses would materially
reduce these projections. See the Disclaimers section at the beginning of this document for more information.
Page 8 of 26
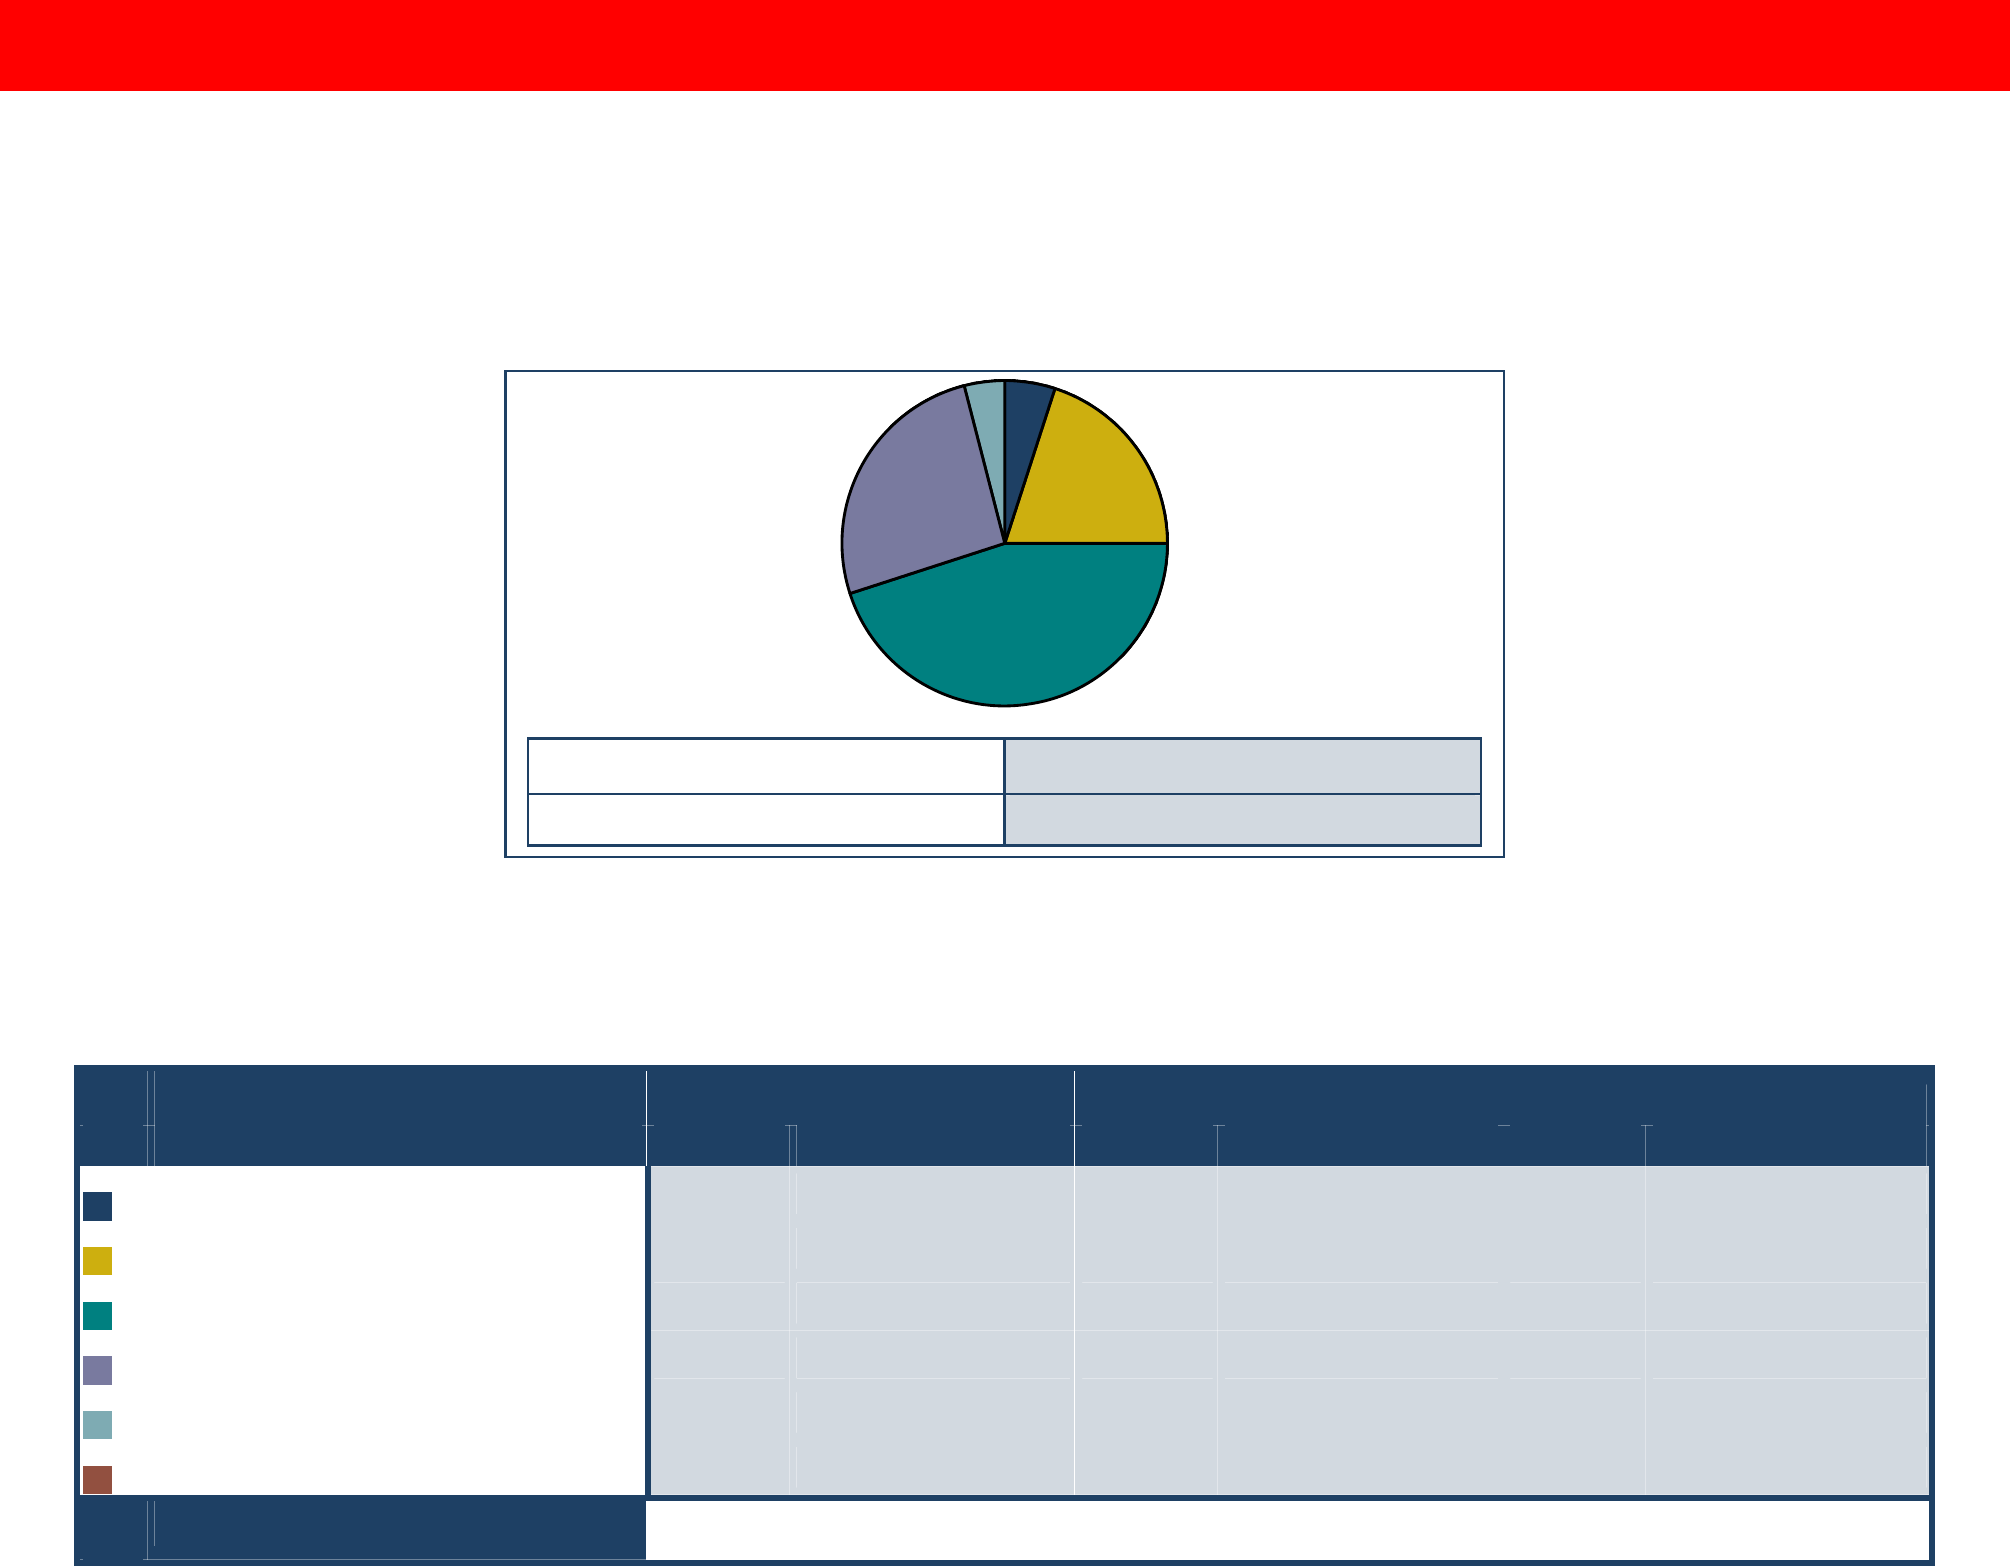
Assumed Asset Mix for Entire Portfolio
This pie graph illustrates the Assumed asset mix for your entire portfolio and will be used for the proposed
plan.
Assumed Asset Mix
Cons Growth
Rate of Return
7.15%
Standard Devi ation 0.00%
The table below pro vides a breakdown of the percentages and dollar values for each asset class in the
current and assumed portfolio. The Change column indicates the rebalancing required t o reach the assumed
asset mix.
Current Asset Mix Change Assumed Asset Mix
Asset Class (%) ($) (%) ($) (%) ($)
Cash
8.2 32,377
-3.2 -12,598
5.0 19,779
Fixed In come
85.6 338,911
-65.6 -259,797
20.0 79,114
Canadian Equity
4.8 18,885
+40.2 +159,122
45.0 178,007
US Equity
+26.0 +102,848
26.0 102,848
Internationa l Equity
+4.0 +15,823
4.0 15,823
Preferreds
1.4 5,398
-1.4 -5,398
Total
100.0
395,570
+0.0
+0
100.0
395,570
Consider the foll ow ing:
• Consider the income tax implications of selling non-registered investments such as stocks that have
grown significantly. You may wish to reallocate this type of asset over time.
• Direct future investment contributions to the appropriate asset allocation.
• Rebalance your portfolio on a regular basis. Some investments grow at a faster rate than others causing
an imbalance in your po rtfolio.
• Consider the timing of each objective. For example, volatile equity (stock) investments are not usually
suitable for goals that are short-term in nature (less than five years).
Important: The projections or other information generated by NaviPlan® version 11.0 regarding the likelihood of various
investment outcomes are hypothetical in nature, do not reflect actual investment results, and are not guarantees of future
results. The projections utilize return data that do not include fees or operating expenses, are not available for
investment, and are shown for illustrative purposes only. If included, fees and other operating expenses would materially
reduce these projections. See the Disclaimers section at the beginning of this document for more information.
Page 9 of 26
Retirement
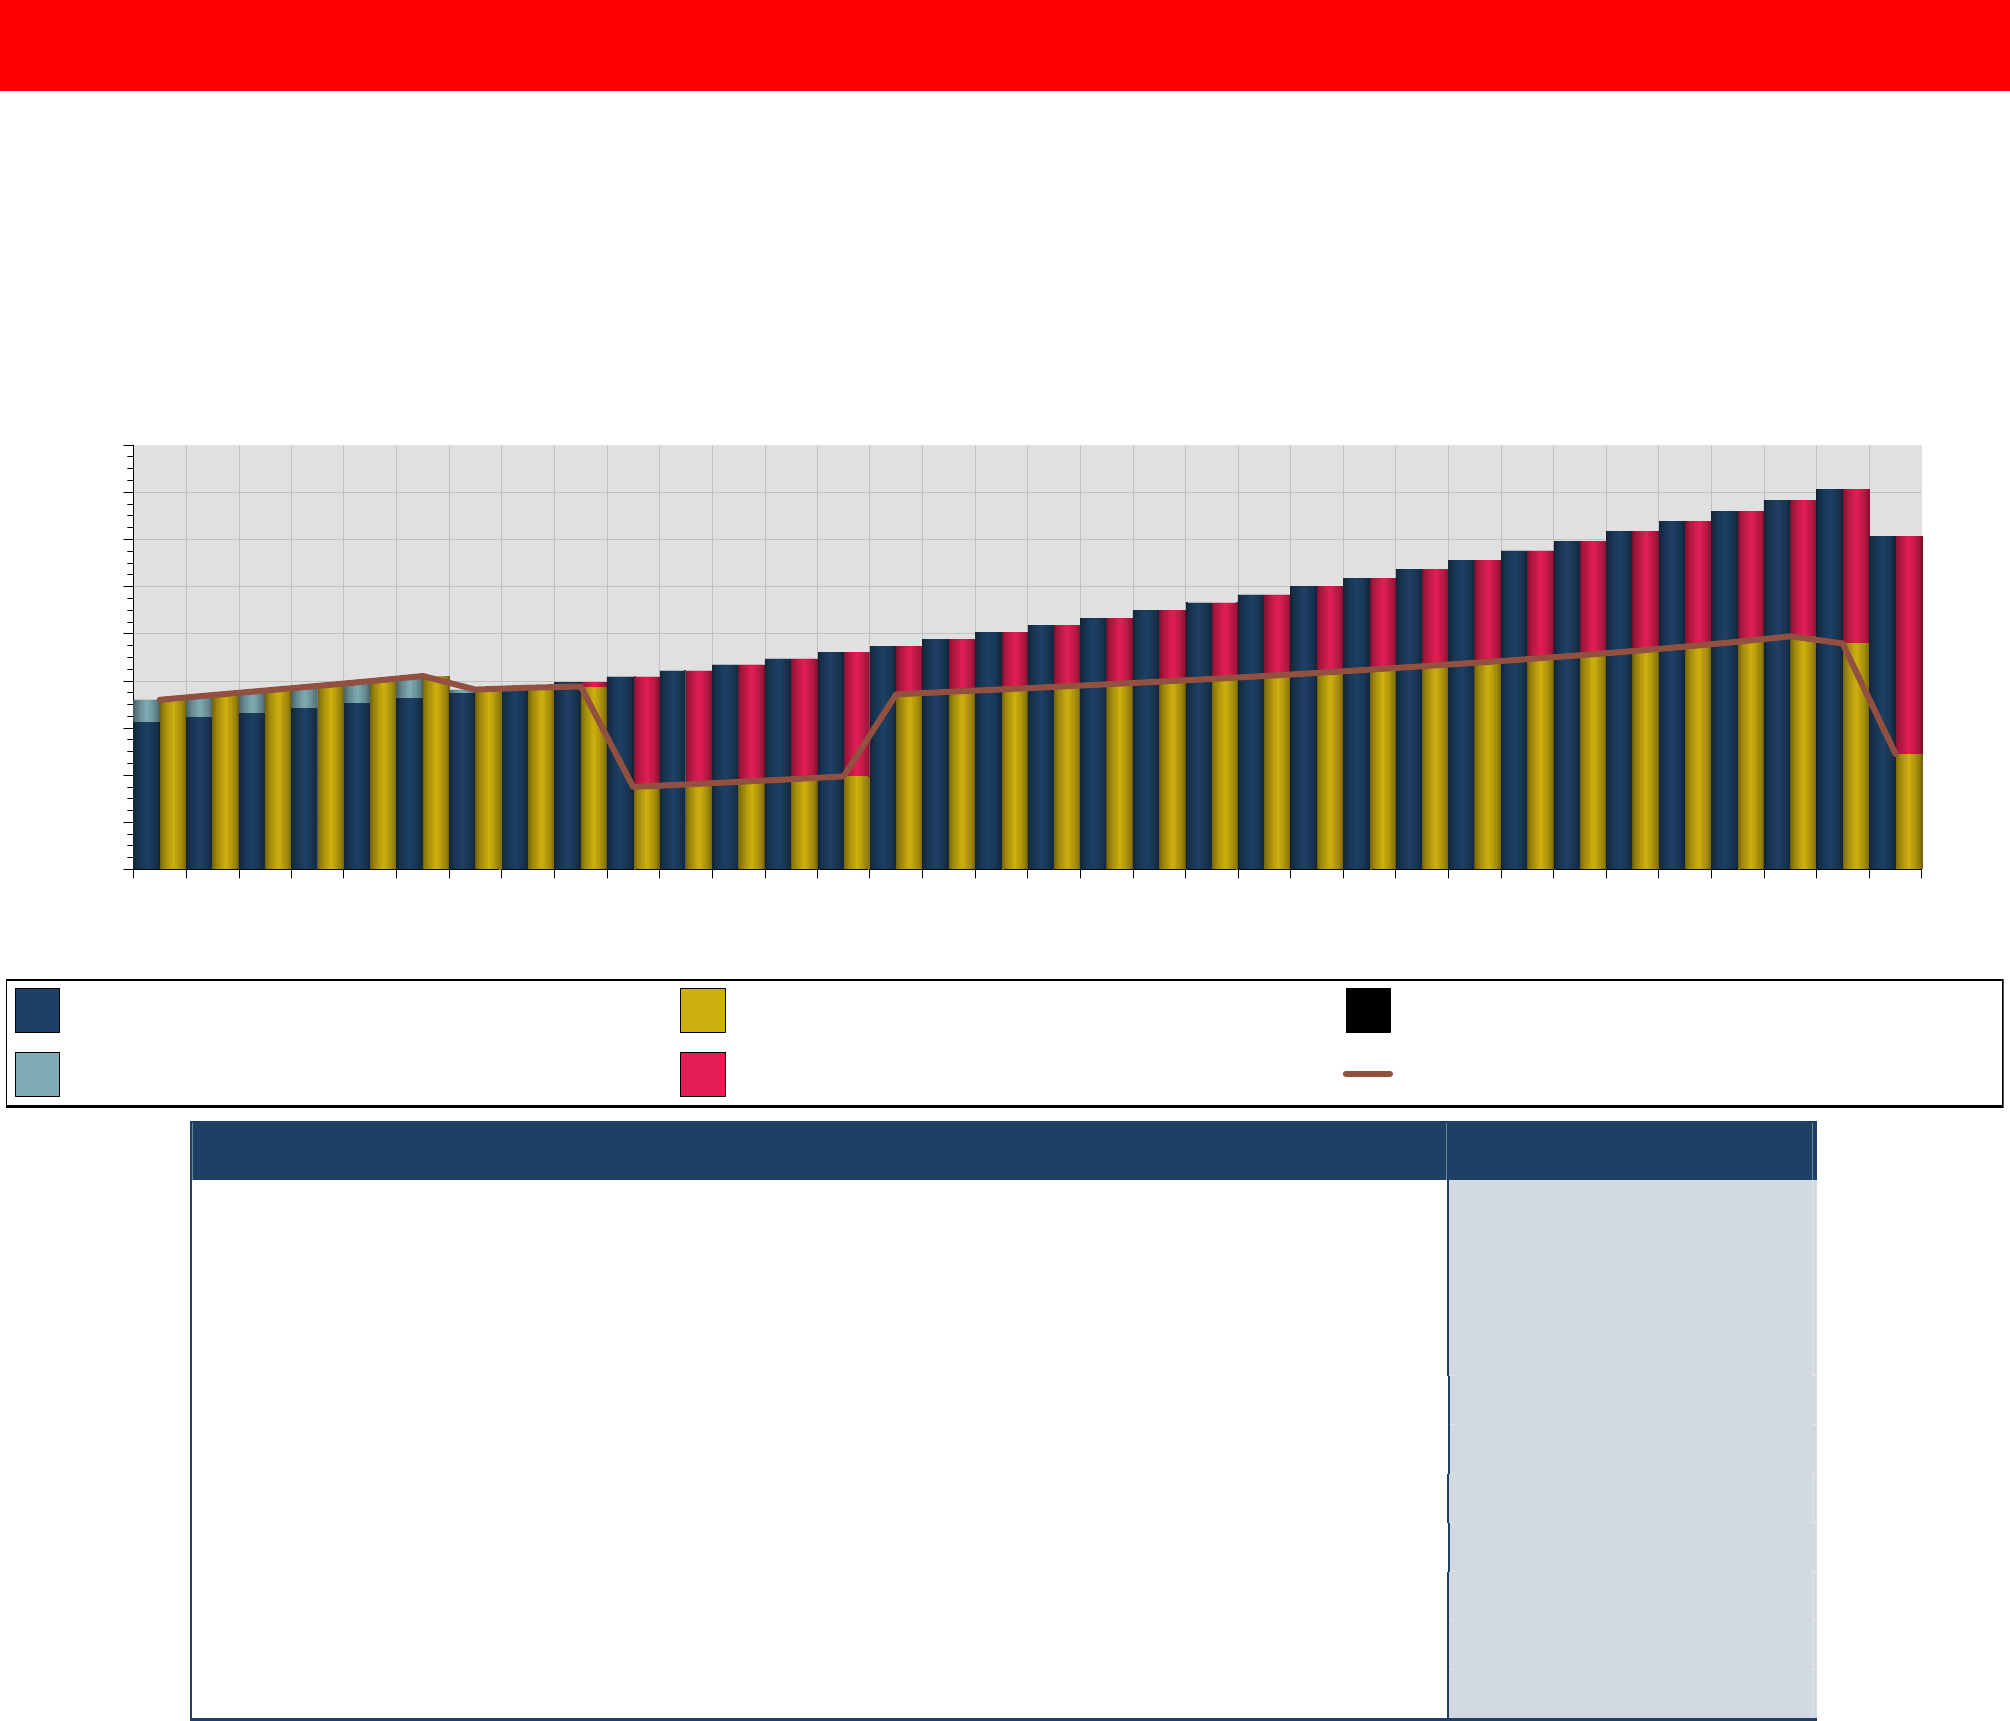
The following graph illustrates your projected needs vs. abilities during retirement. The top graph displays
your current financial situation without additional savings, with a rate of return of 4.98%.
Retirement Needs Vs. Abilities
Current Plan
2018 2020 2022 2024 2026 2028 2030 2032 2034 2036 2038 2040 2042 2044 2046 2048 2050
$0K
$20K
$40K
$60K
$80K
$100K
$120K
$140K
$160K
$180K
Retirement Needs
Other Needs
Ability to Cover Needs
Shortfall
Surplus
After-Tax Cash Inflow
Financia l Object iv es Current
John's Retirement Age/Year 58 / 2018
John's Life Ex pectancy 90 / 2050
Mary's Retirement Age/Year 57 / 2018
Mary's Life Expectancy 90 / 2051
Annual Needs at Retirement, in today's dollars $48,000
Inflation Rate 3.00%
Return Rate 4.98%
Available Assets $395,570
Assumed Monthly Savings $547
Note: Numbers in bold indicate a change from the Current Plan.
Important: The projections or other information generated by NaviPlan® version 11.0 regarding the likelihood of various
investment outcomes are hypothetical in nature, do not reflect actual investment results, and are not guarantees of future
results. The projections utilize return data that do not include fees or operating expenses, are not available for
investment, and are shown for illustrative purposes only. If included, fees and other operating expenses would materially
reduce these projections. See the Disclaimers section at the beginning of this document for more information.
Page 10 of 26
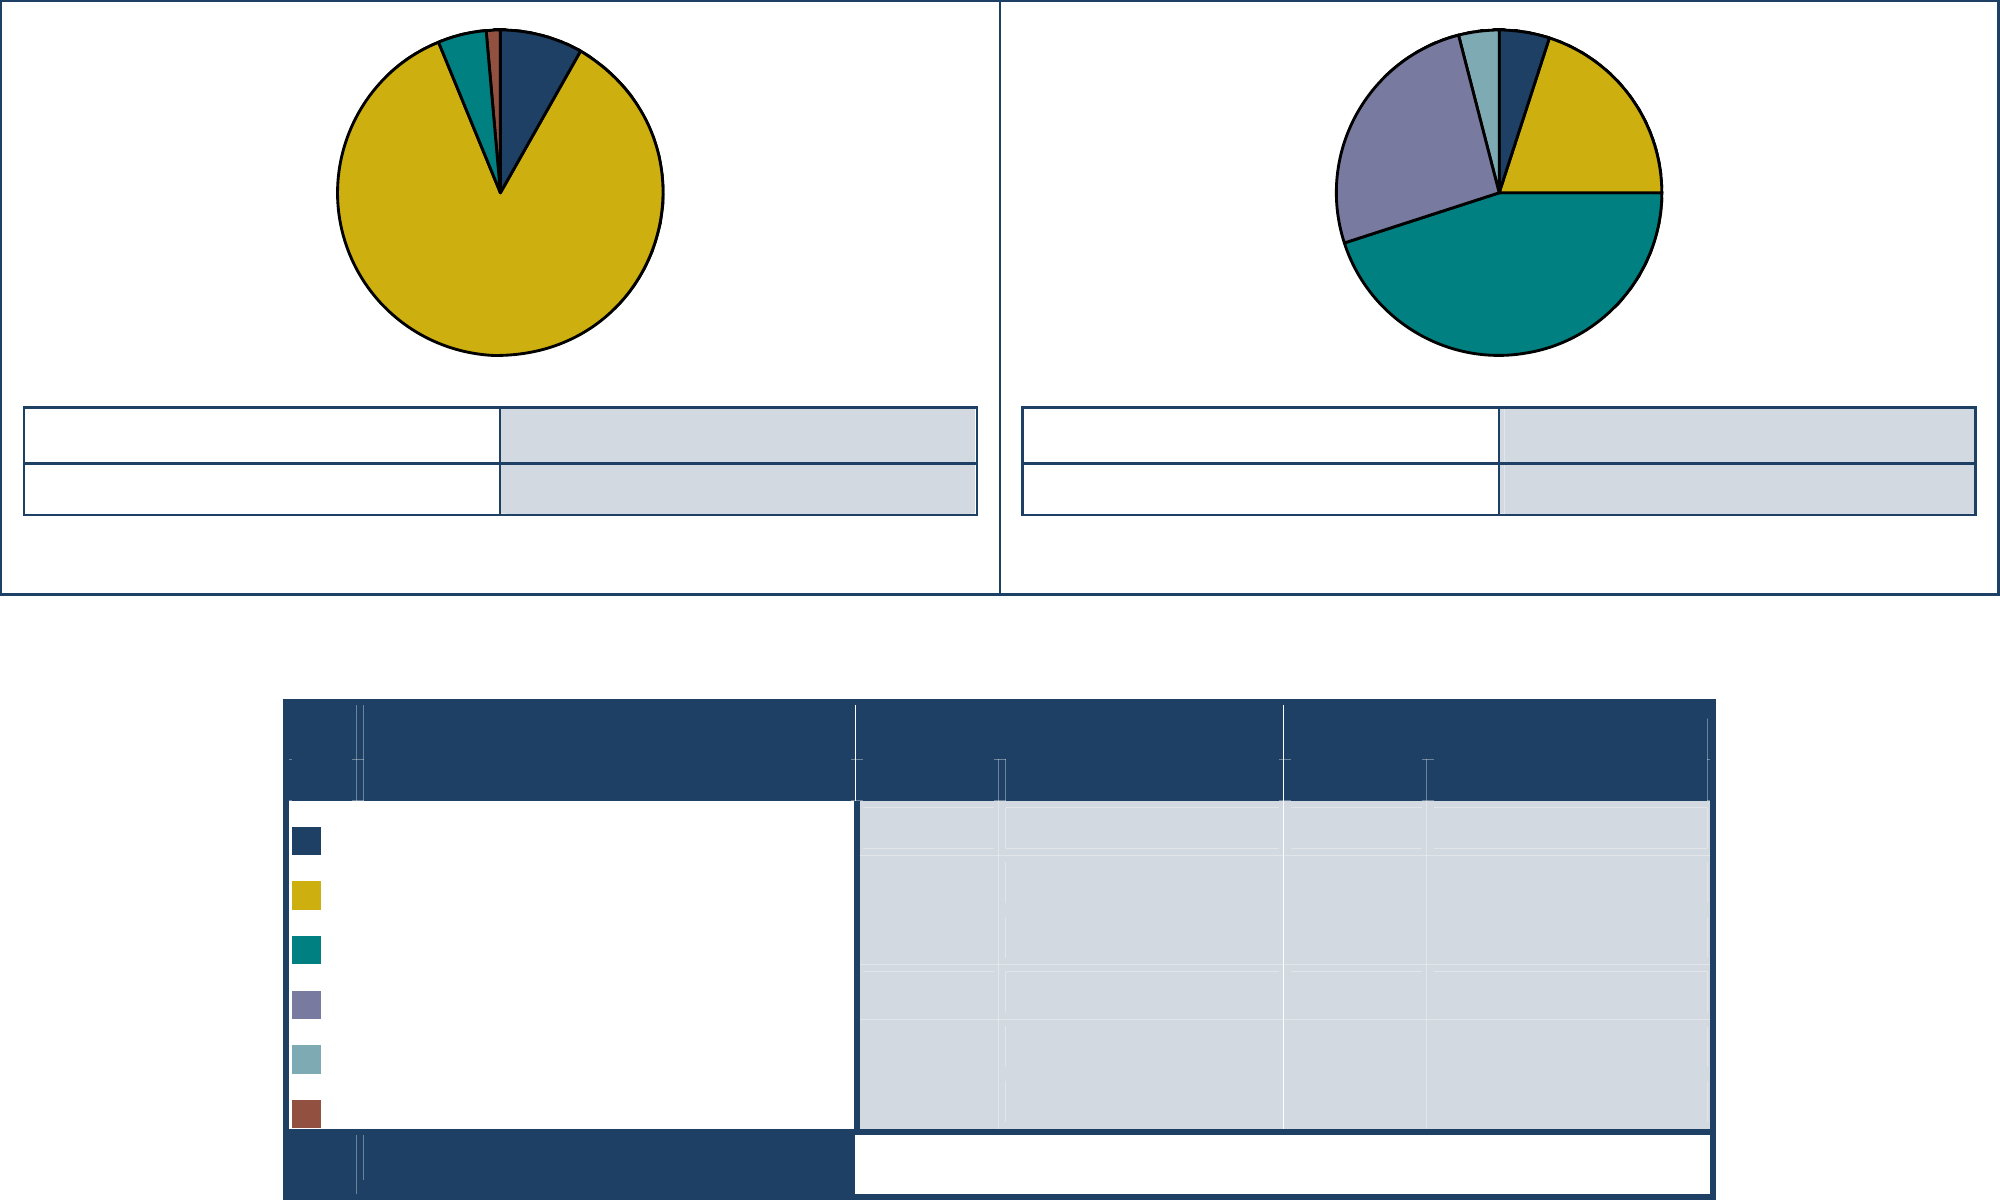
Asset Allocation for Retirement
These pie graphs illustrate your current asset mix and suggested asset mix for your retirement goal.
However, the suggested asset mix will not be used in the proposed plan. Due to modifications the assumed
asset mix on the following page will be used instead.
Current Asset Mix Suggested Asset Mix*
Cons Growth
Rate of Return
4.98%
Standard Devi ation 0.00%
Rate of Return
7.15%
Standard Devi ation 0.00%
*Modifications have been made to the suggested asset mix.
Current Asset Mix Suggested Asset Mix
Asset Class (%) ($) (%) ($)
Cash
8.2 32,377 5.0 19,779
Fixed In come
85.6 338,911 20.0 79,114
Canadian Equity
4.8 18,885 45.0 178,006
US Equity
26.0 102,848
Internationa l Equity
4.0 15,823
Preferreds
1.4 5,398
Total
100.0
395,570
100.0
395,570
Important: The projections or other information generated by NaviPlan® version 11.0 regarding the likelihood of various
investment outcomes are hypothetical in nature, do not reflect actual investment results, and are not guarantees of future
results. The projections utilize return data that do not include fees or operating expenses, are not available for
investment, and are shown for illustrative purposes only. If included, fees and other operating expenses would materially
reduce these projections. See the Disclaimers section at the beginning of this document for more information.
Page 11 of 26
Assumed Asset Allocation for Retirement
This pie graph illustrates the Assumed asset mix for your retirement goal and will be used for the proposed
plan.
Assumed Asset Mix
Retirement
Cons Growth
Rate of Return
7.15%
Standard Devi ation 0.00%
The table below pro vides a breakdown of the percentages and dollar values for each asset class in the
current and assumed portfolio. The Change column indicates the rebalancing required t o reach the assumed
asset mix.
Current Asset Mix Change Assumed Asset Mix
Asset Class (%) ($) (%) ($) (%) ($)
Cash
8.2 32,377
-3.2 -12,598
5.0 19,779
Fixed In come
85.6 338,911
-65.6 -259,797
20.0 79,114
Canadian Equity
4.8 18,885
+40.2 +159,122
45.0 178,007
US Equity
+26.0 +102,848
26.0 102,848
Internationa l Equity
+4.0 +15,823
4.0 15,823
Preferreds
1.4 5,398
-1.4 -5,398
Total
100.0
395,570
+0.0
+0
100.0
395,570
Consider the foll ow ing:
• The required monthly savings amount is based on savings to non registered assets. Registered savings
plans, such as RRSPs and LIRAs may reduce the amount you need to save. We should discuss the
various alternatives that are available to you.
• Maximize contributions to tax-advantaged registered retirement plans.
• If you feel the amount of your required savings is unmanageable, we should review the various goals to
find an appropriate solution: should you consider looking at alternative asset allocation, or perhaps
reduce your income need or delay retirement?
• If your projected savings is greater than your need, you may h ave the opportunity to spend more in
retirement. Additionally, a large surplus may indicate the need for estate planning.
• Retirement is often the first financial objective that comes to mind. We want to ensure that your
pensions, Old Age Security, and savings provide a comfortable retirement.
• If you have not already do ne so, begin investing on a regular basis.